Decode Every Analytics Attribute
Instantly transform raw query strings and encoded payloads into clean, readable attributes across Adobe, Google Analytics, Target, AJO, and dozens of other platforms.
View screenshot Beacon
Capture, decode, and validate tracking calls without proxies or setup. Beacon gives Adobe Experience Platform teams a calmer, clearer way to debug data quality before it ships.
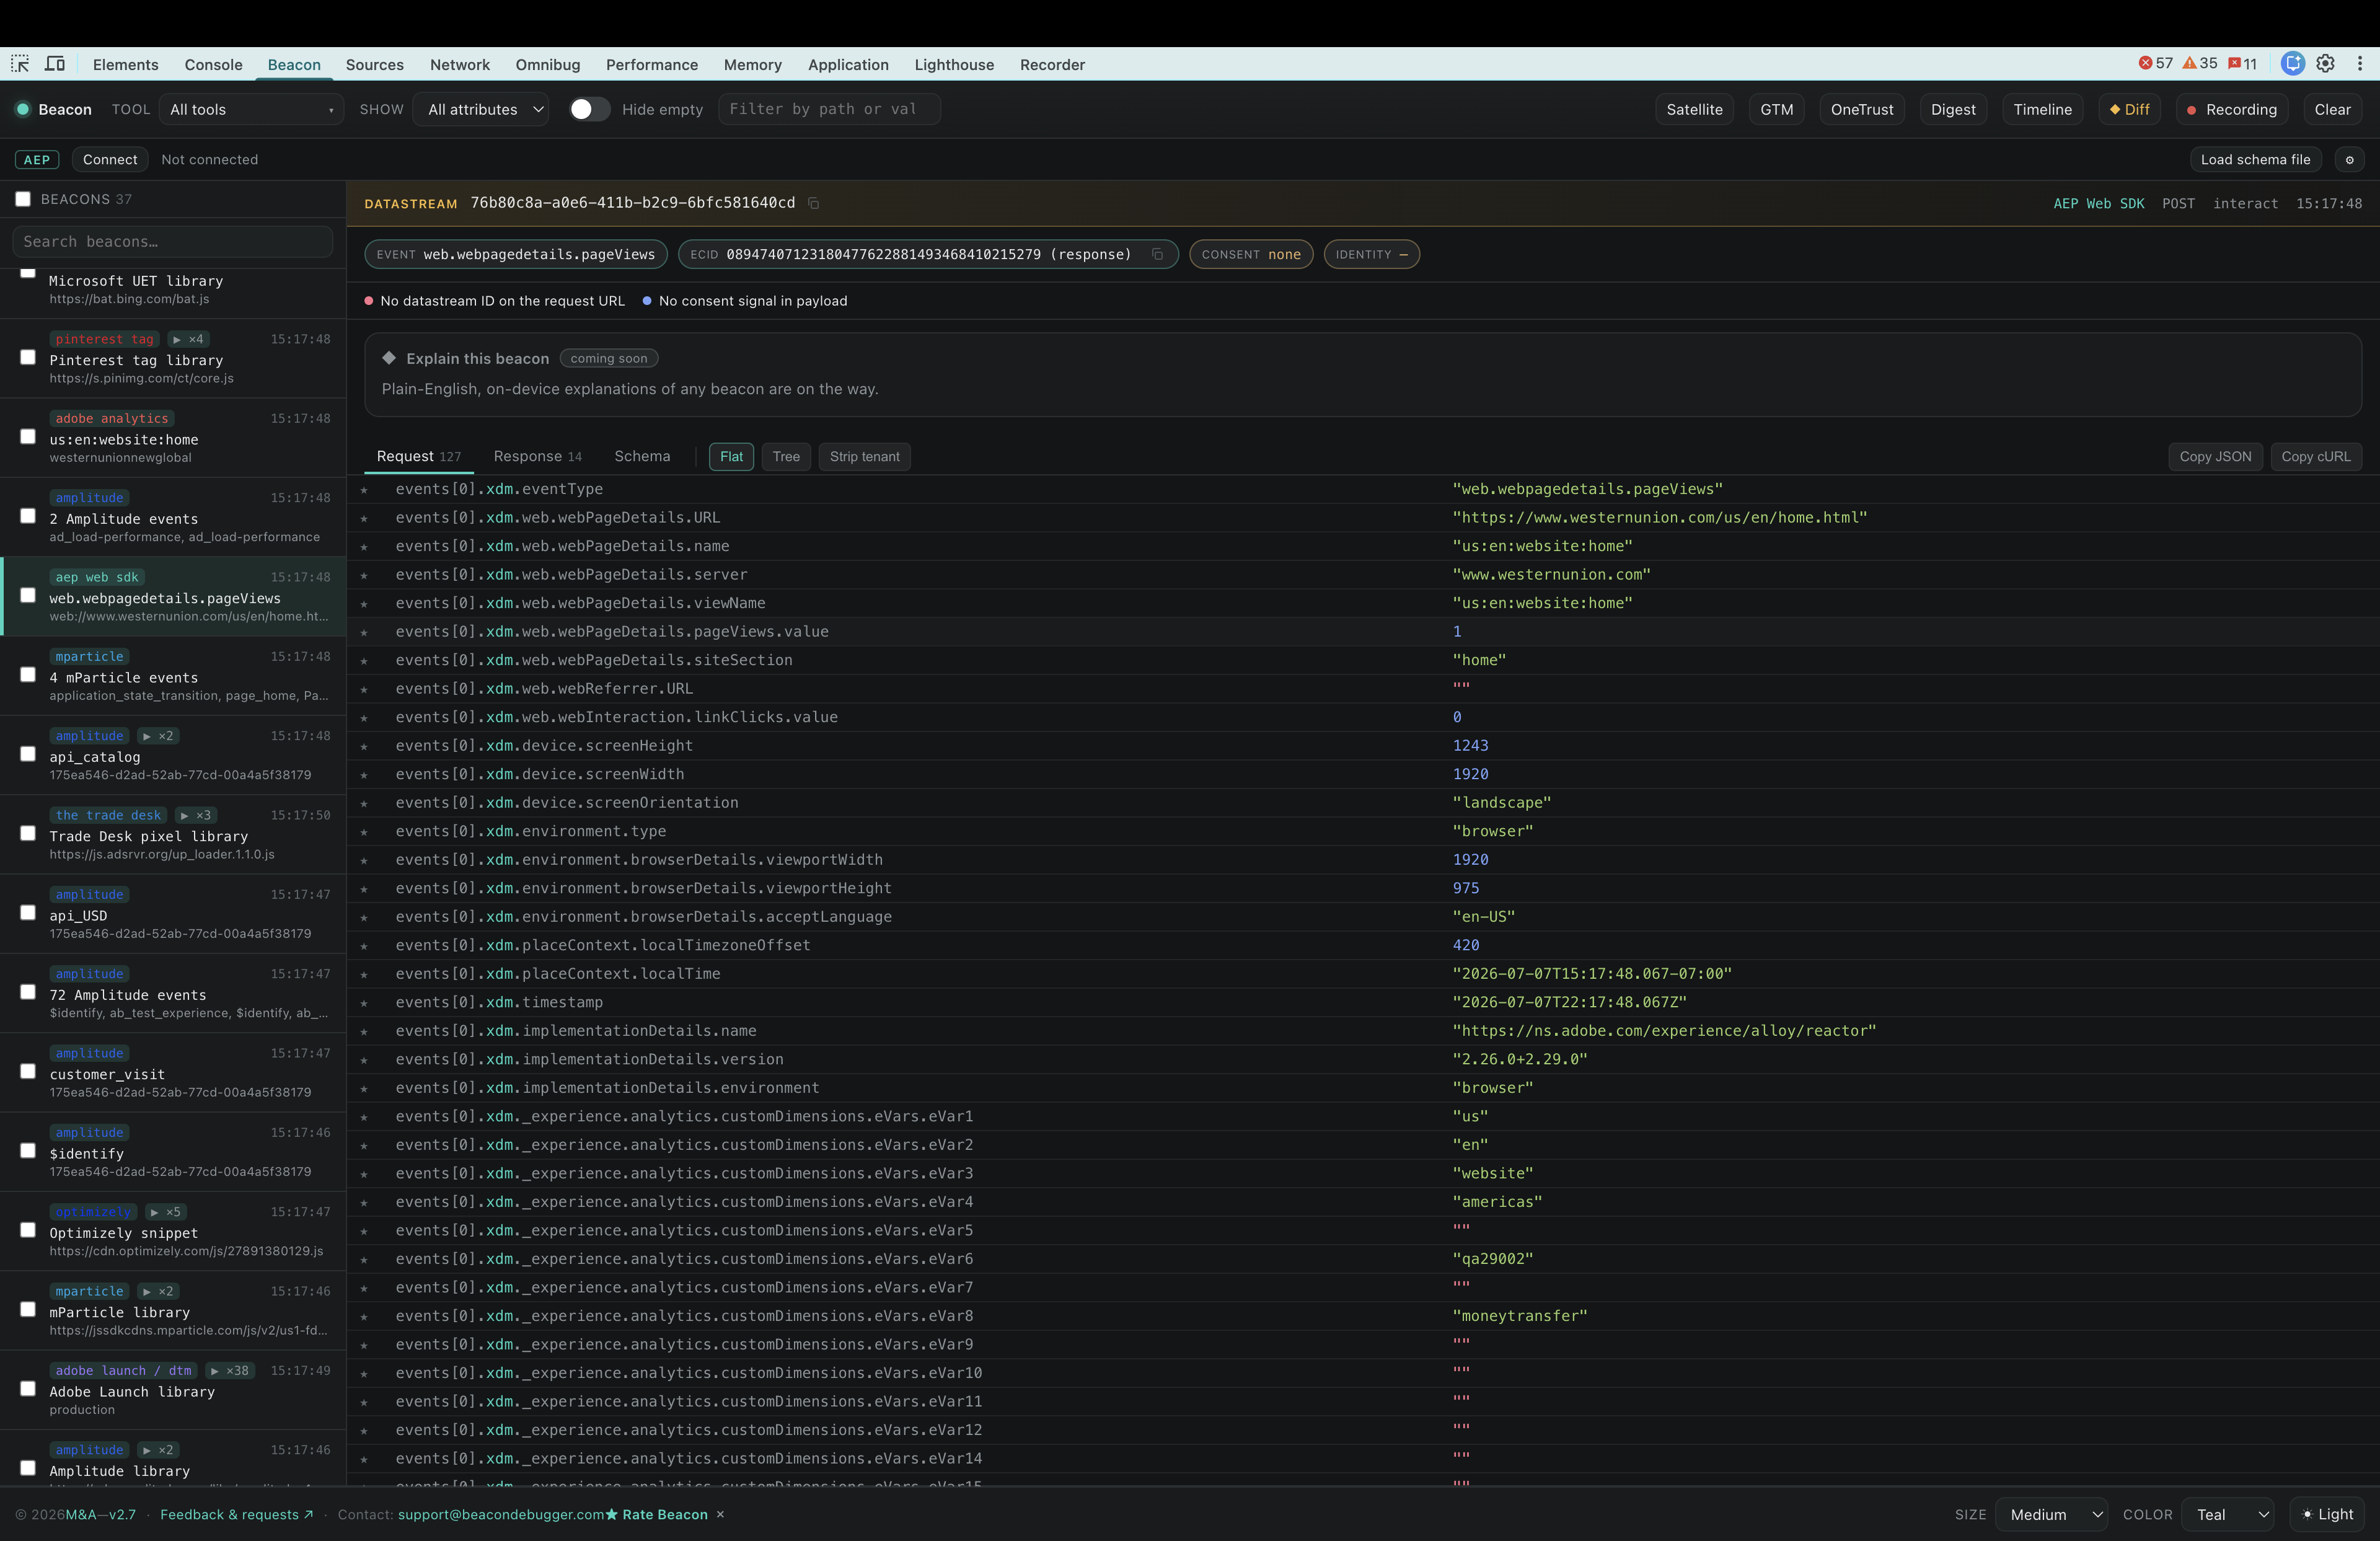
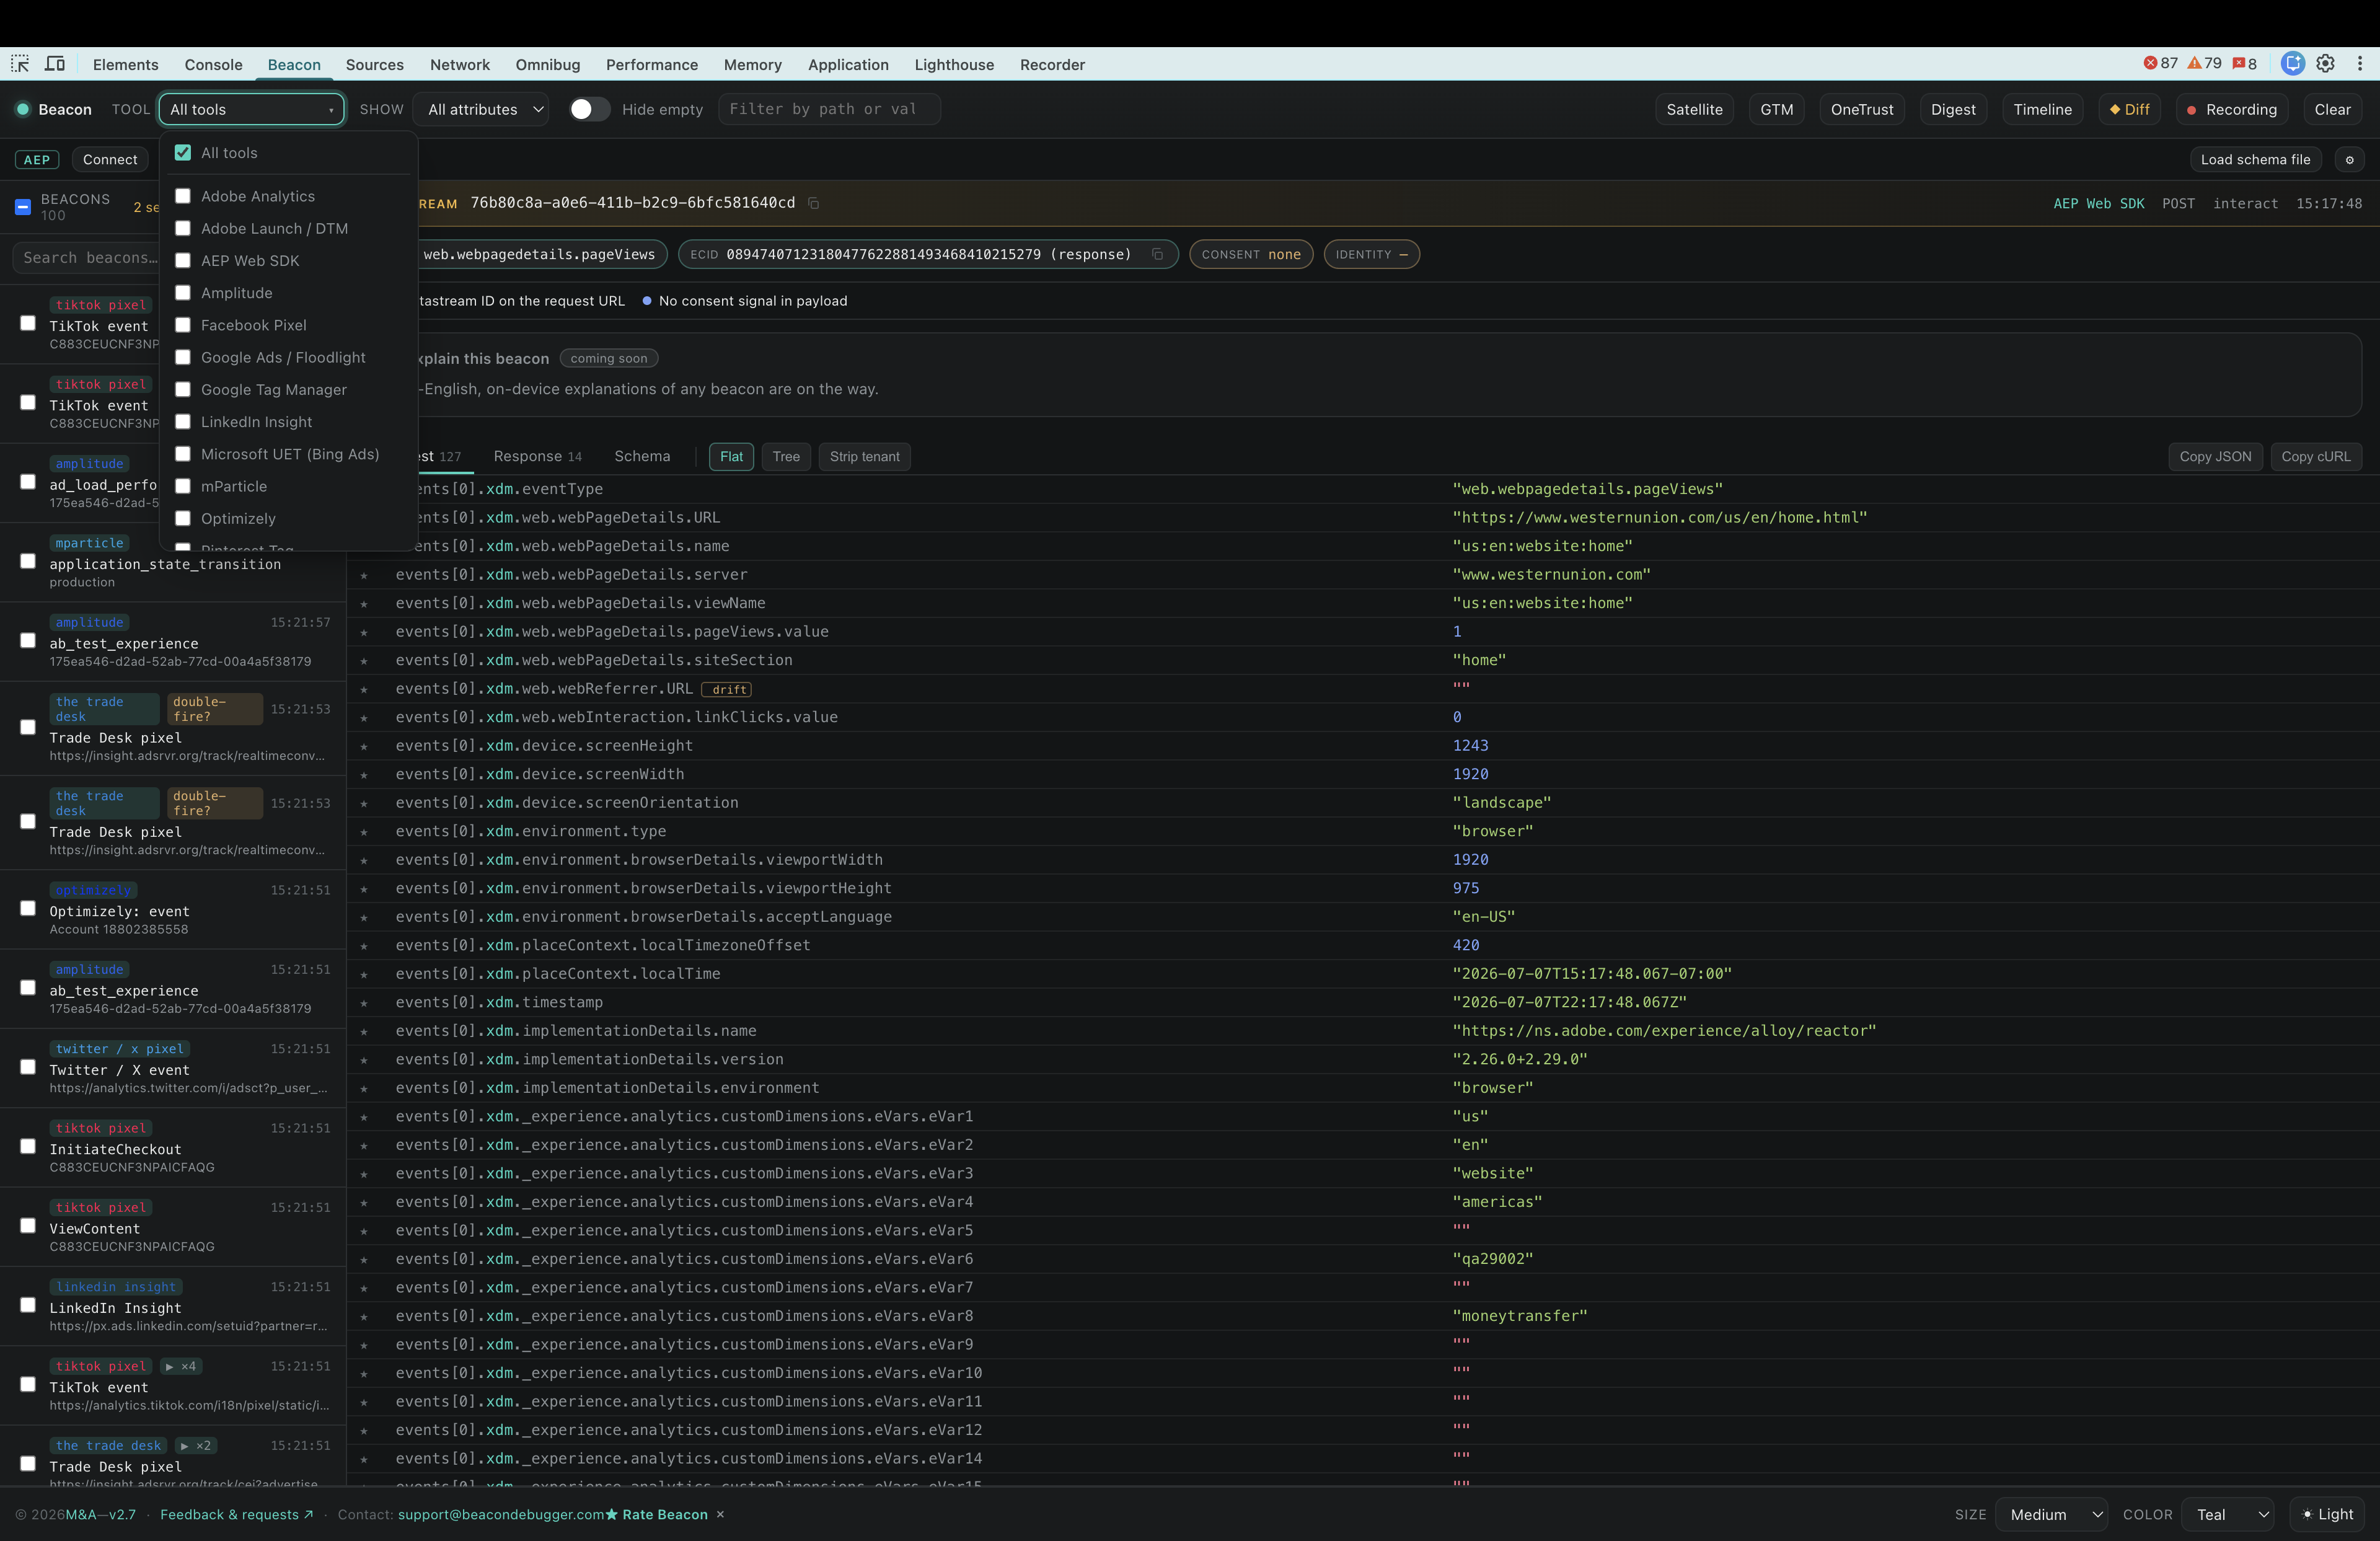
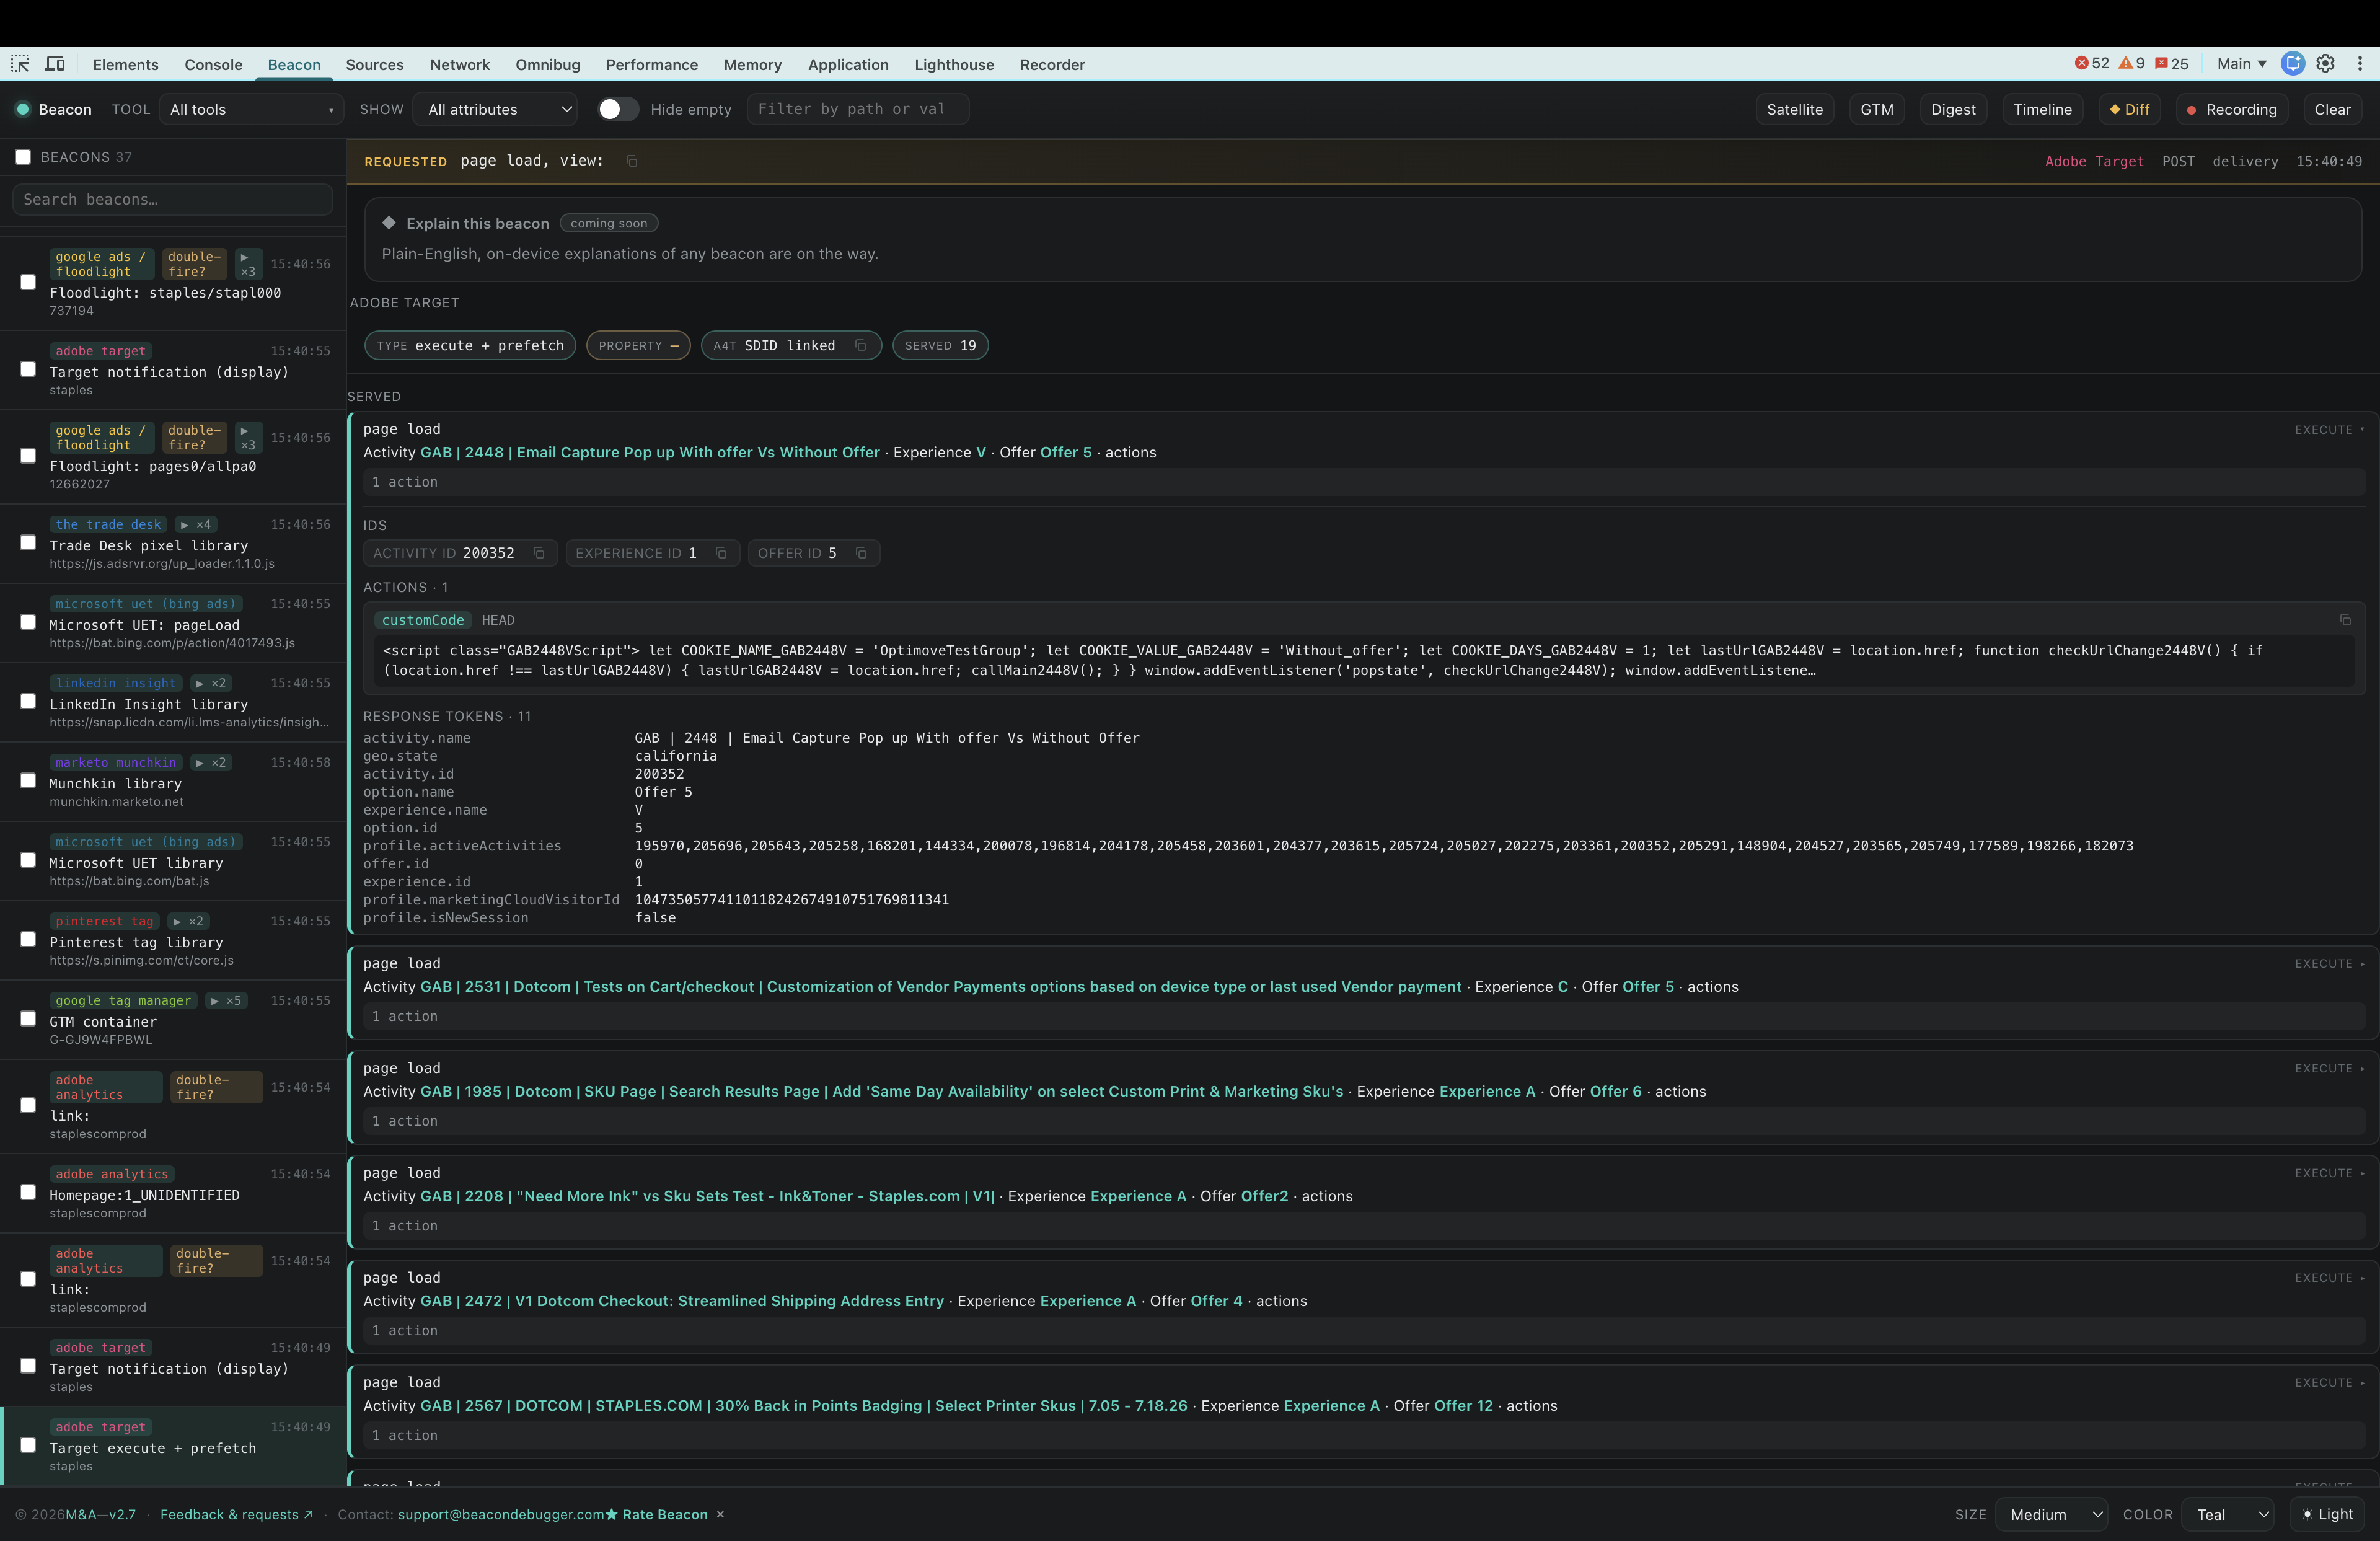
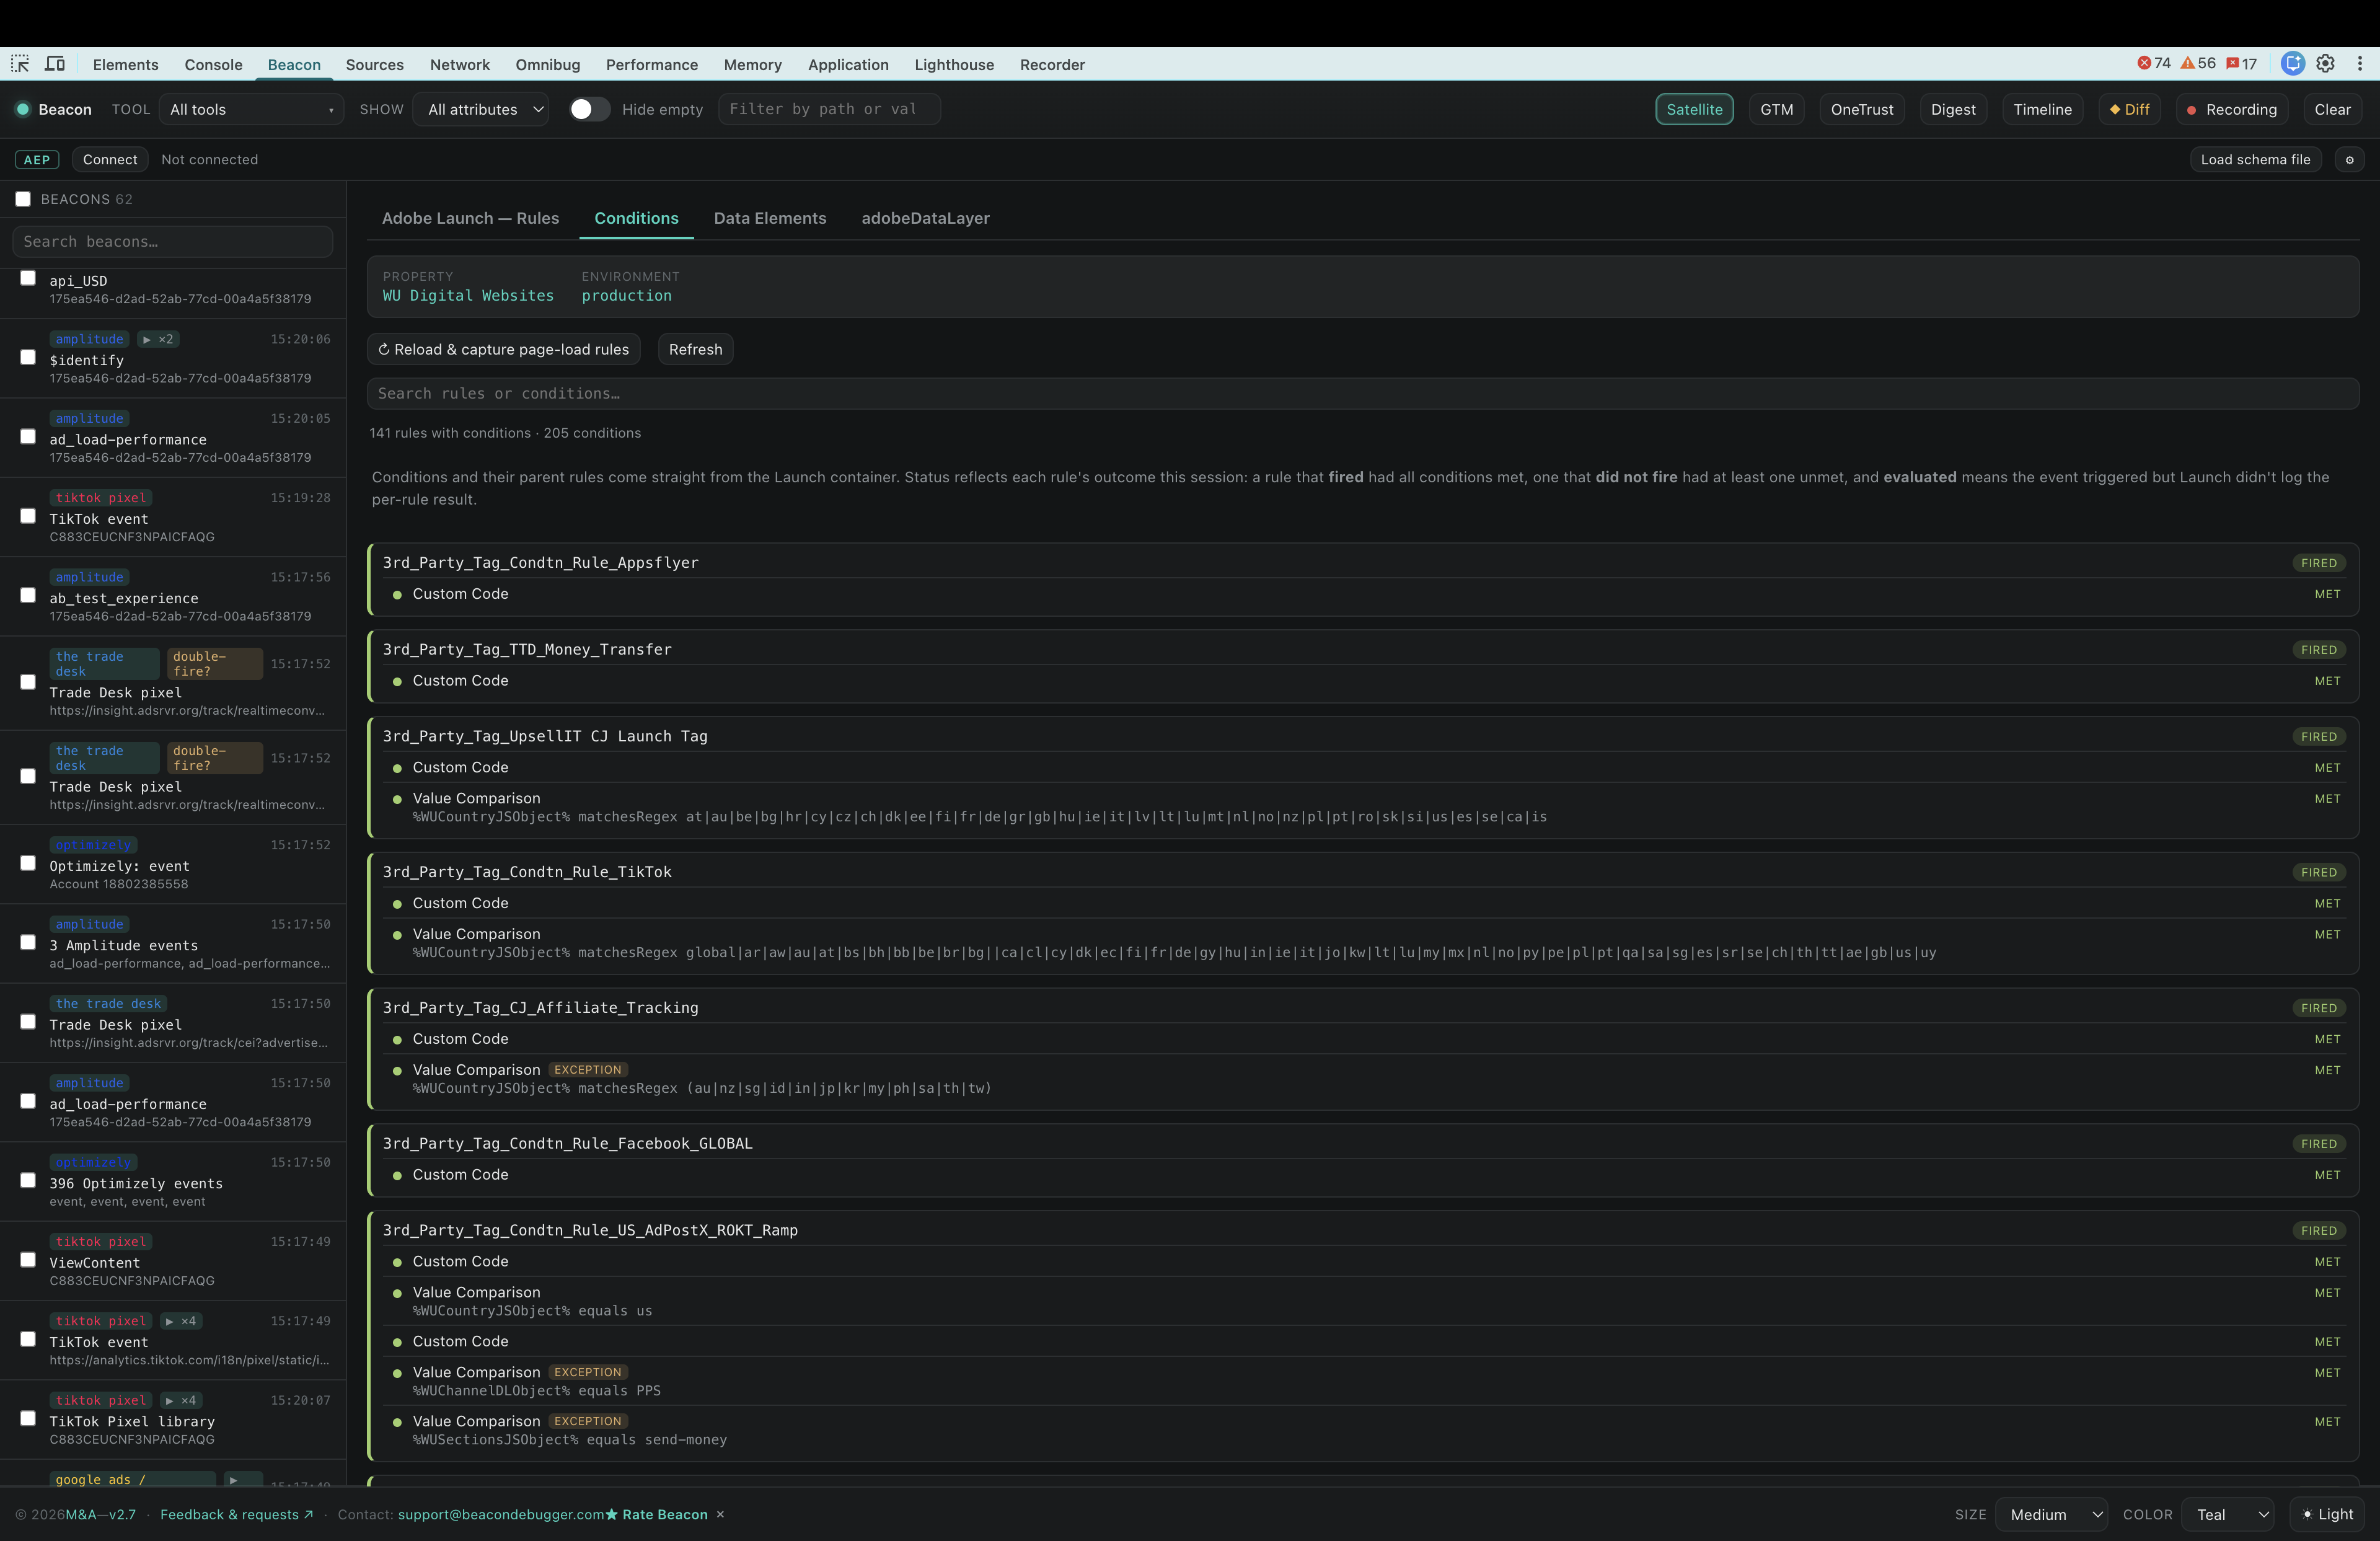
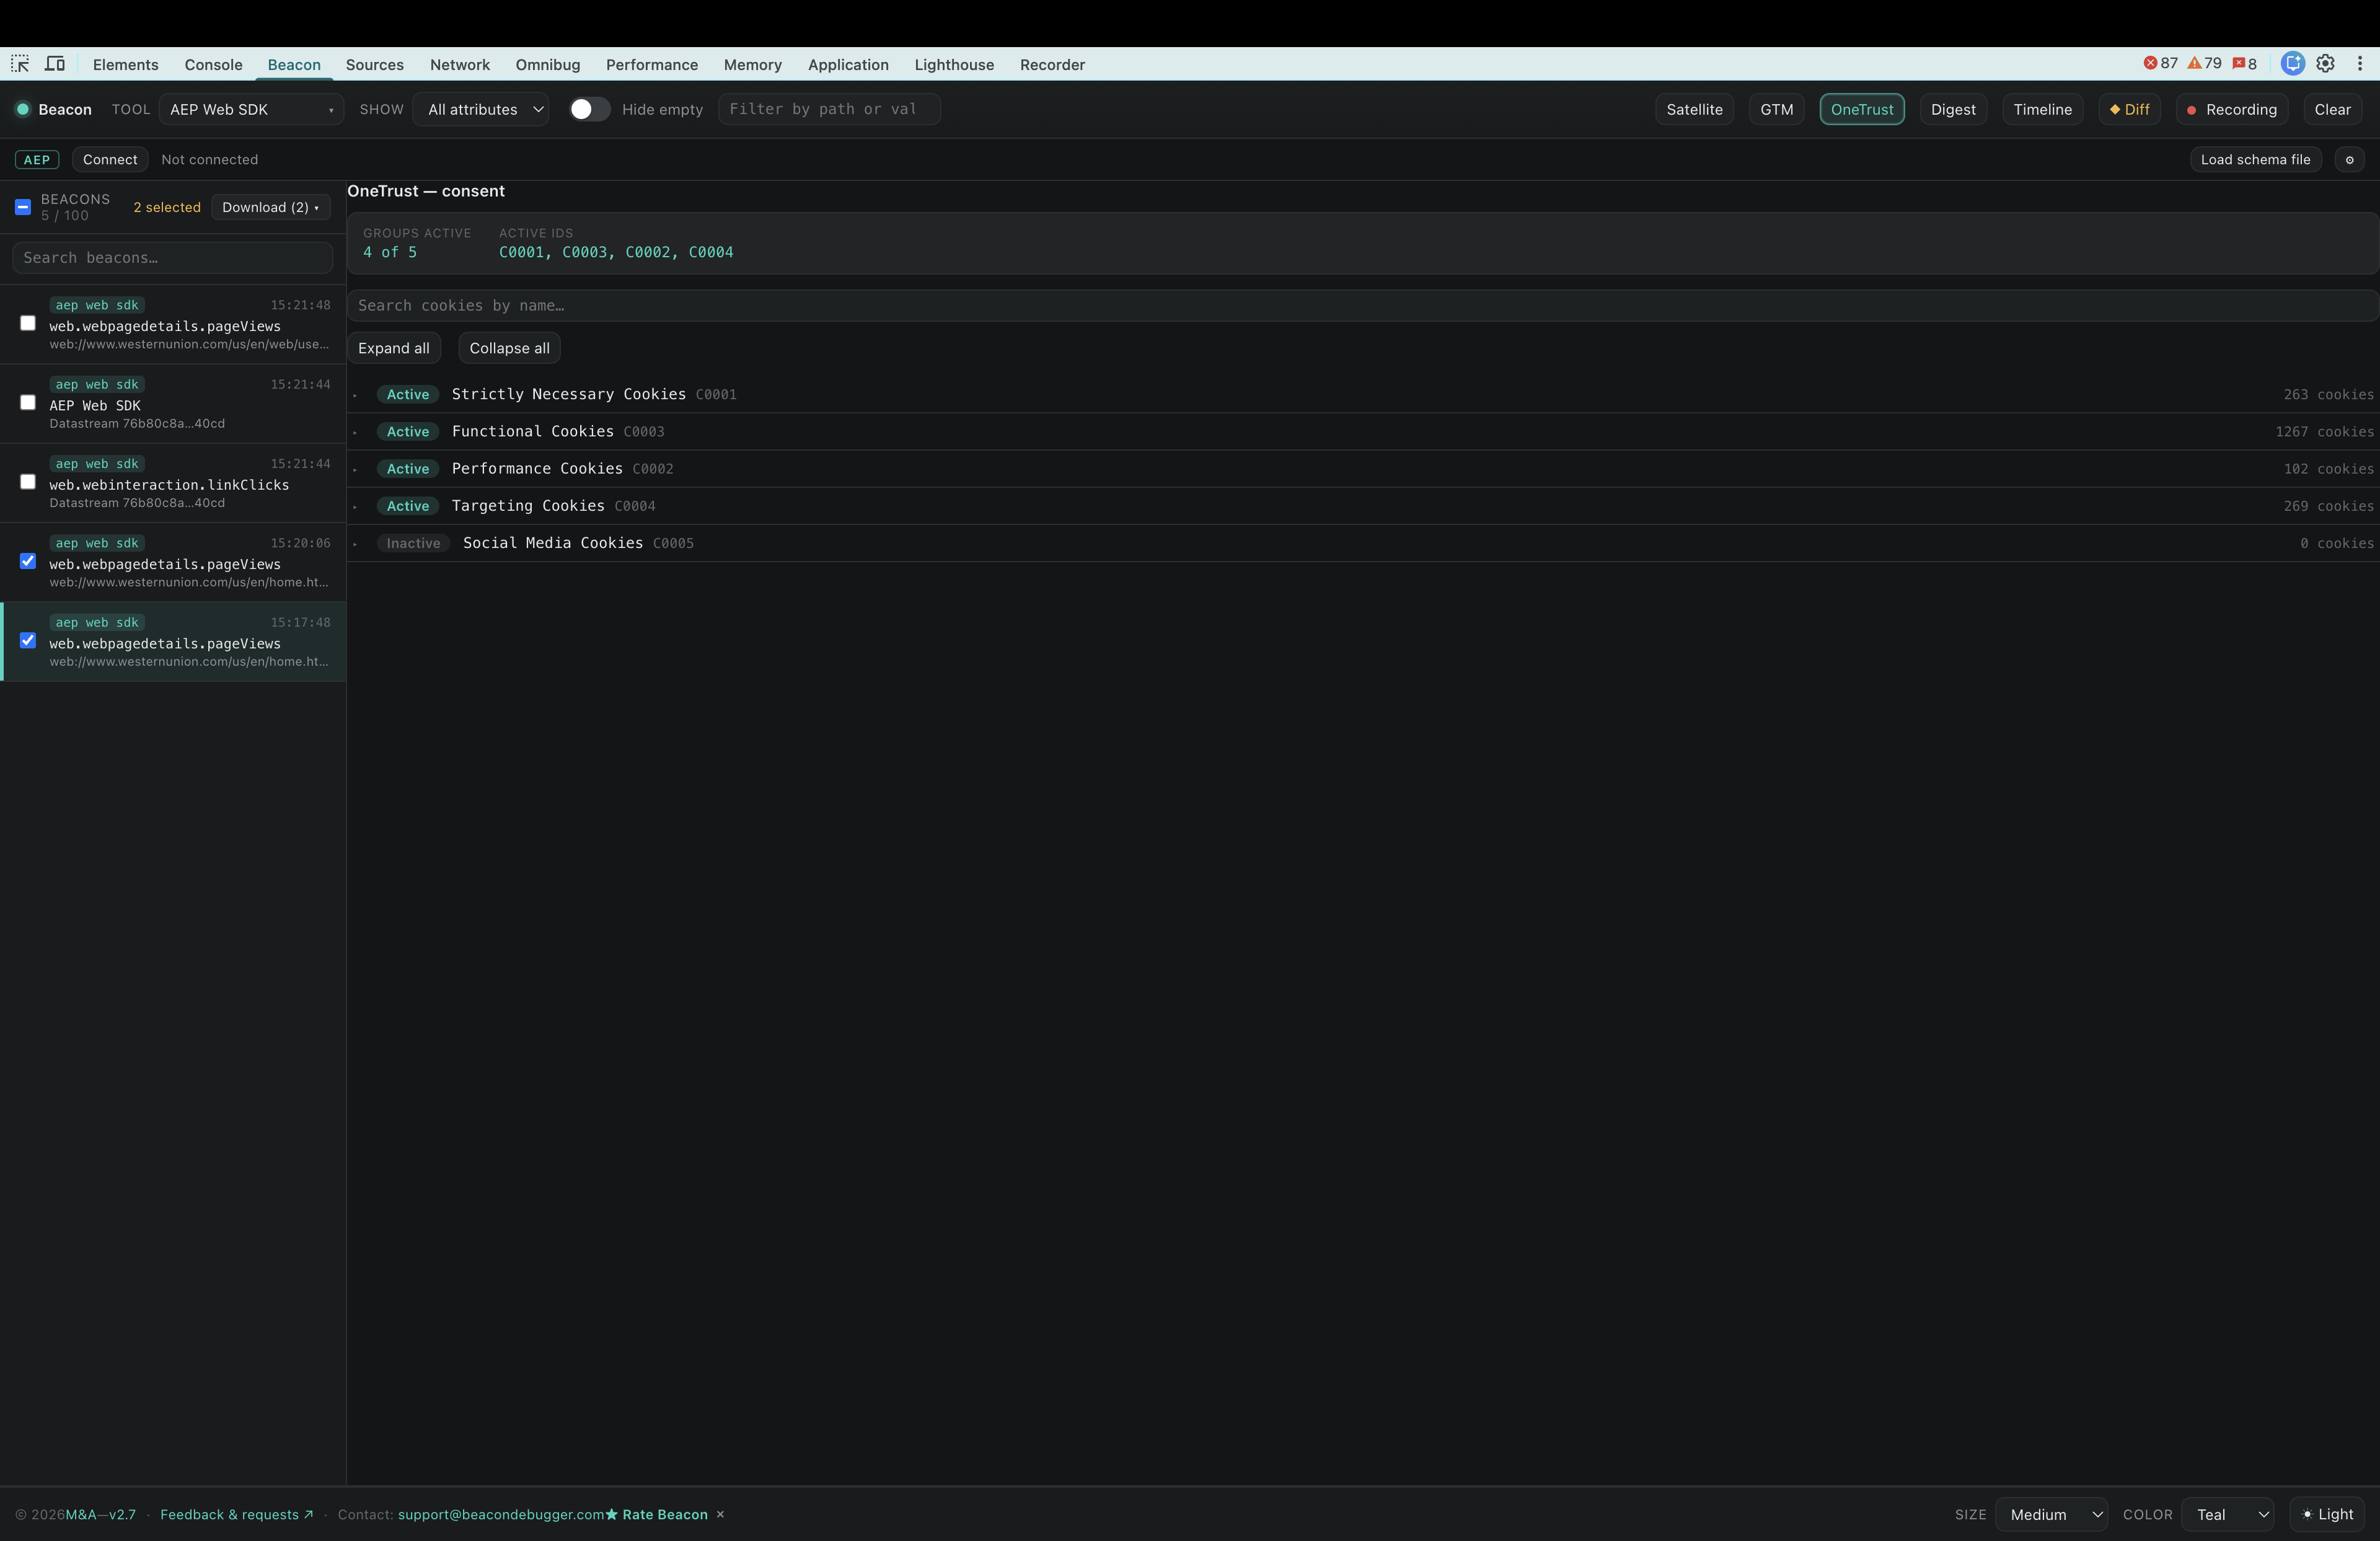
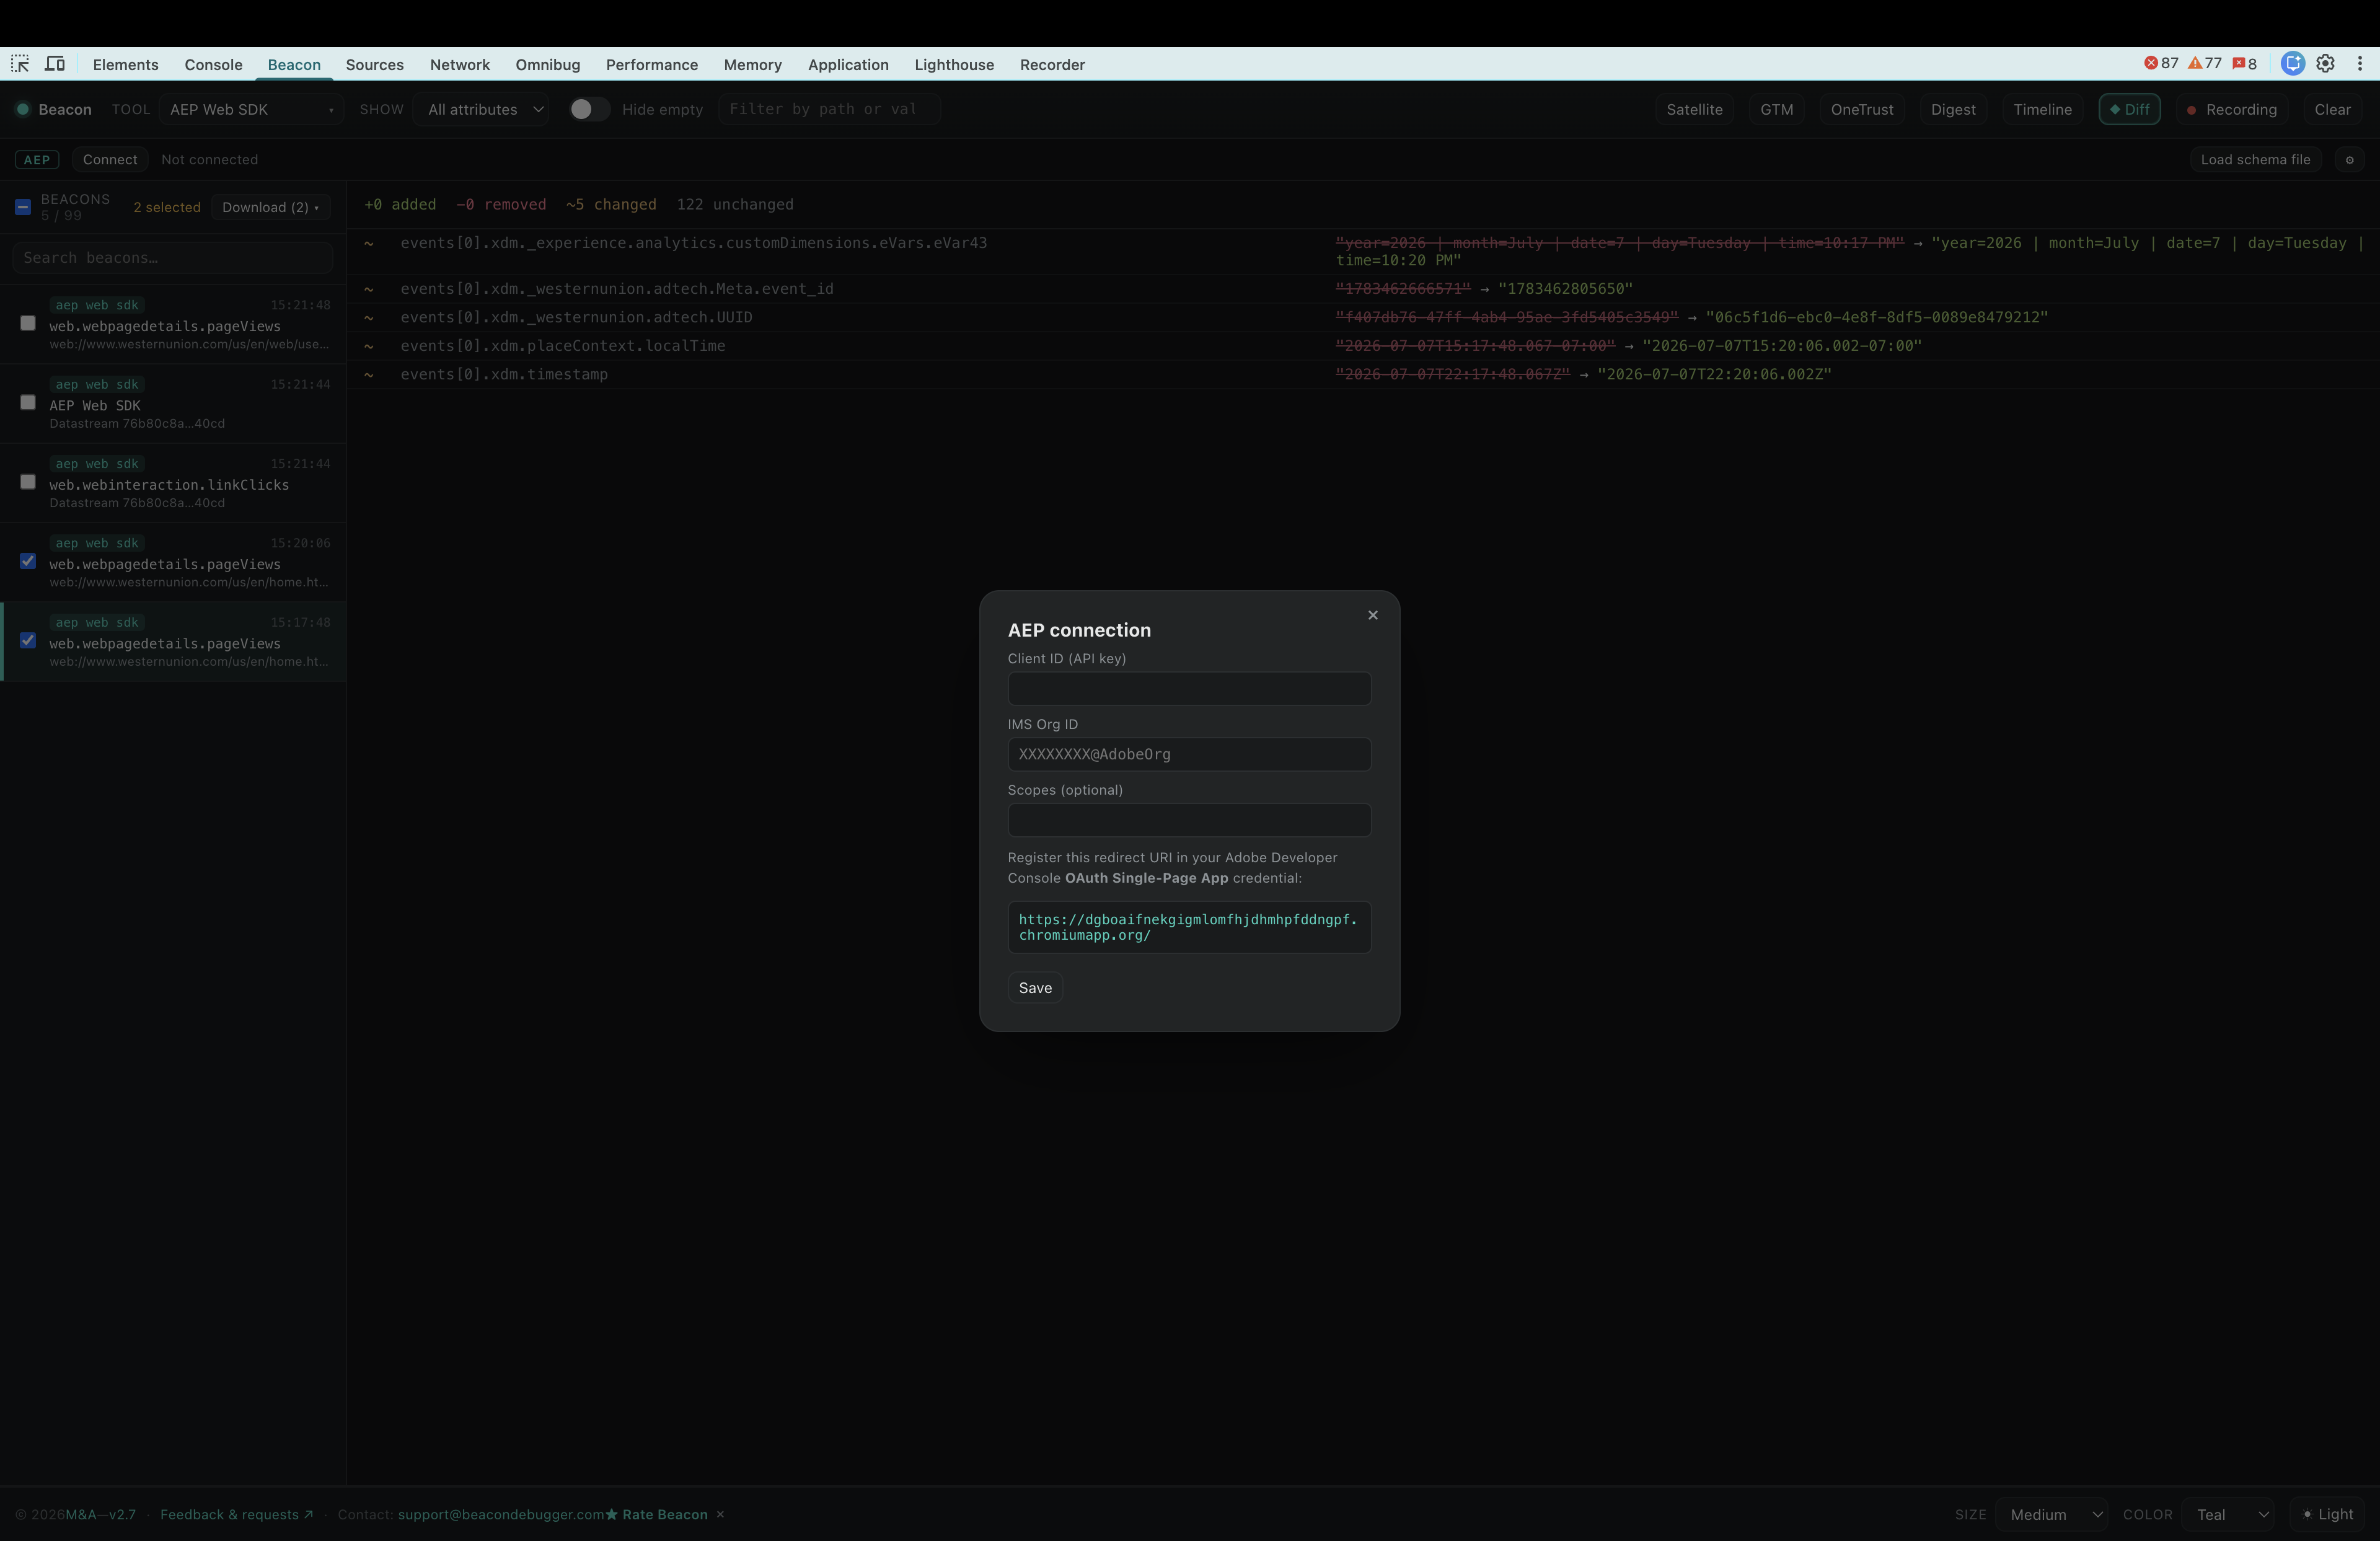
Beacon organizes noisy network traffic into readable, actionable signals for analytics QA, implementation reviews, and production monitoring.
Instantly transform raw query strings and encoded payloads into clean, readable attributes across Adobe, Google Analytics, Target, AJO, and dozens of other platforms.
View screenshotMonitor every analytics, marketing, consent, and personalization request directly inside DevTools—without proxies, certificates, or complicated setup.
View screenshotSee every Activity, Experience, Offer, Audience, and Action in one place. Inspect what Target actually delivered—not just the network request.
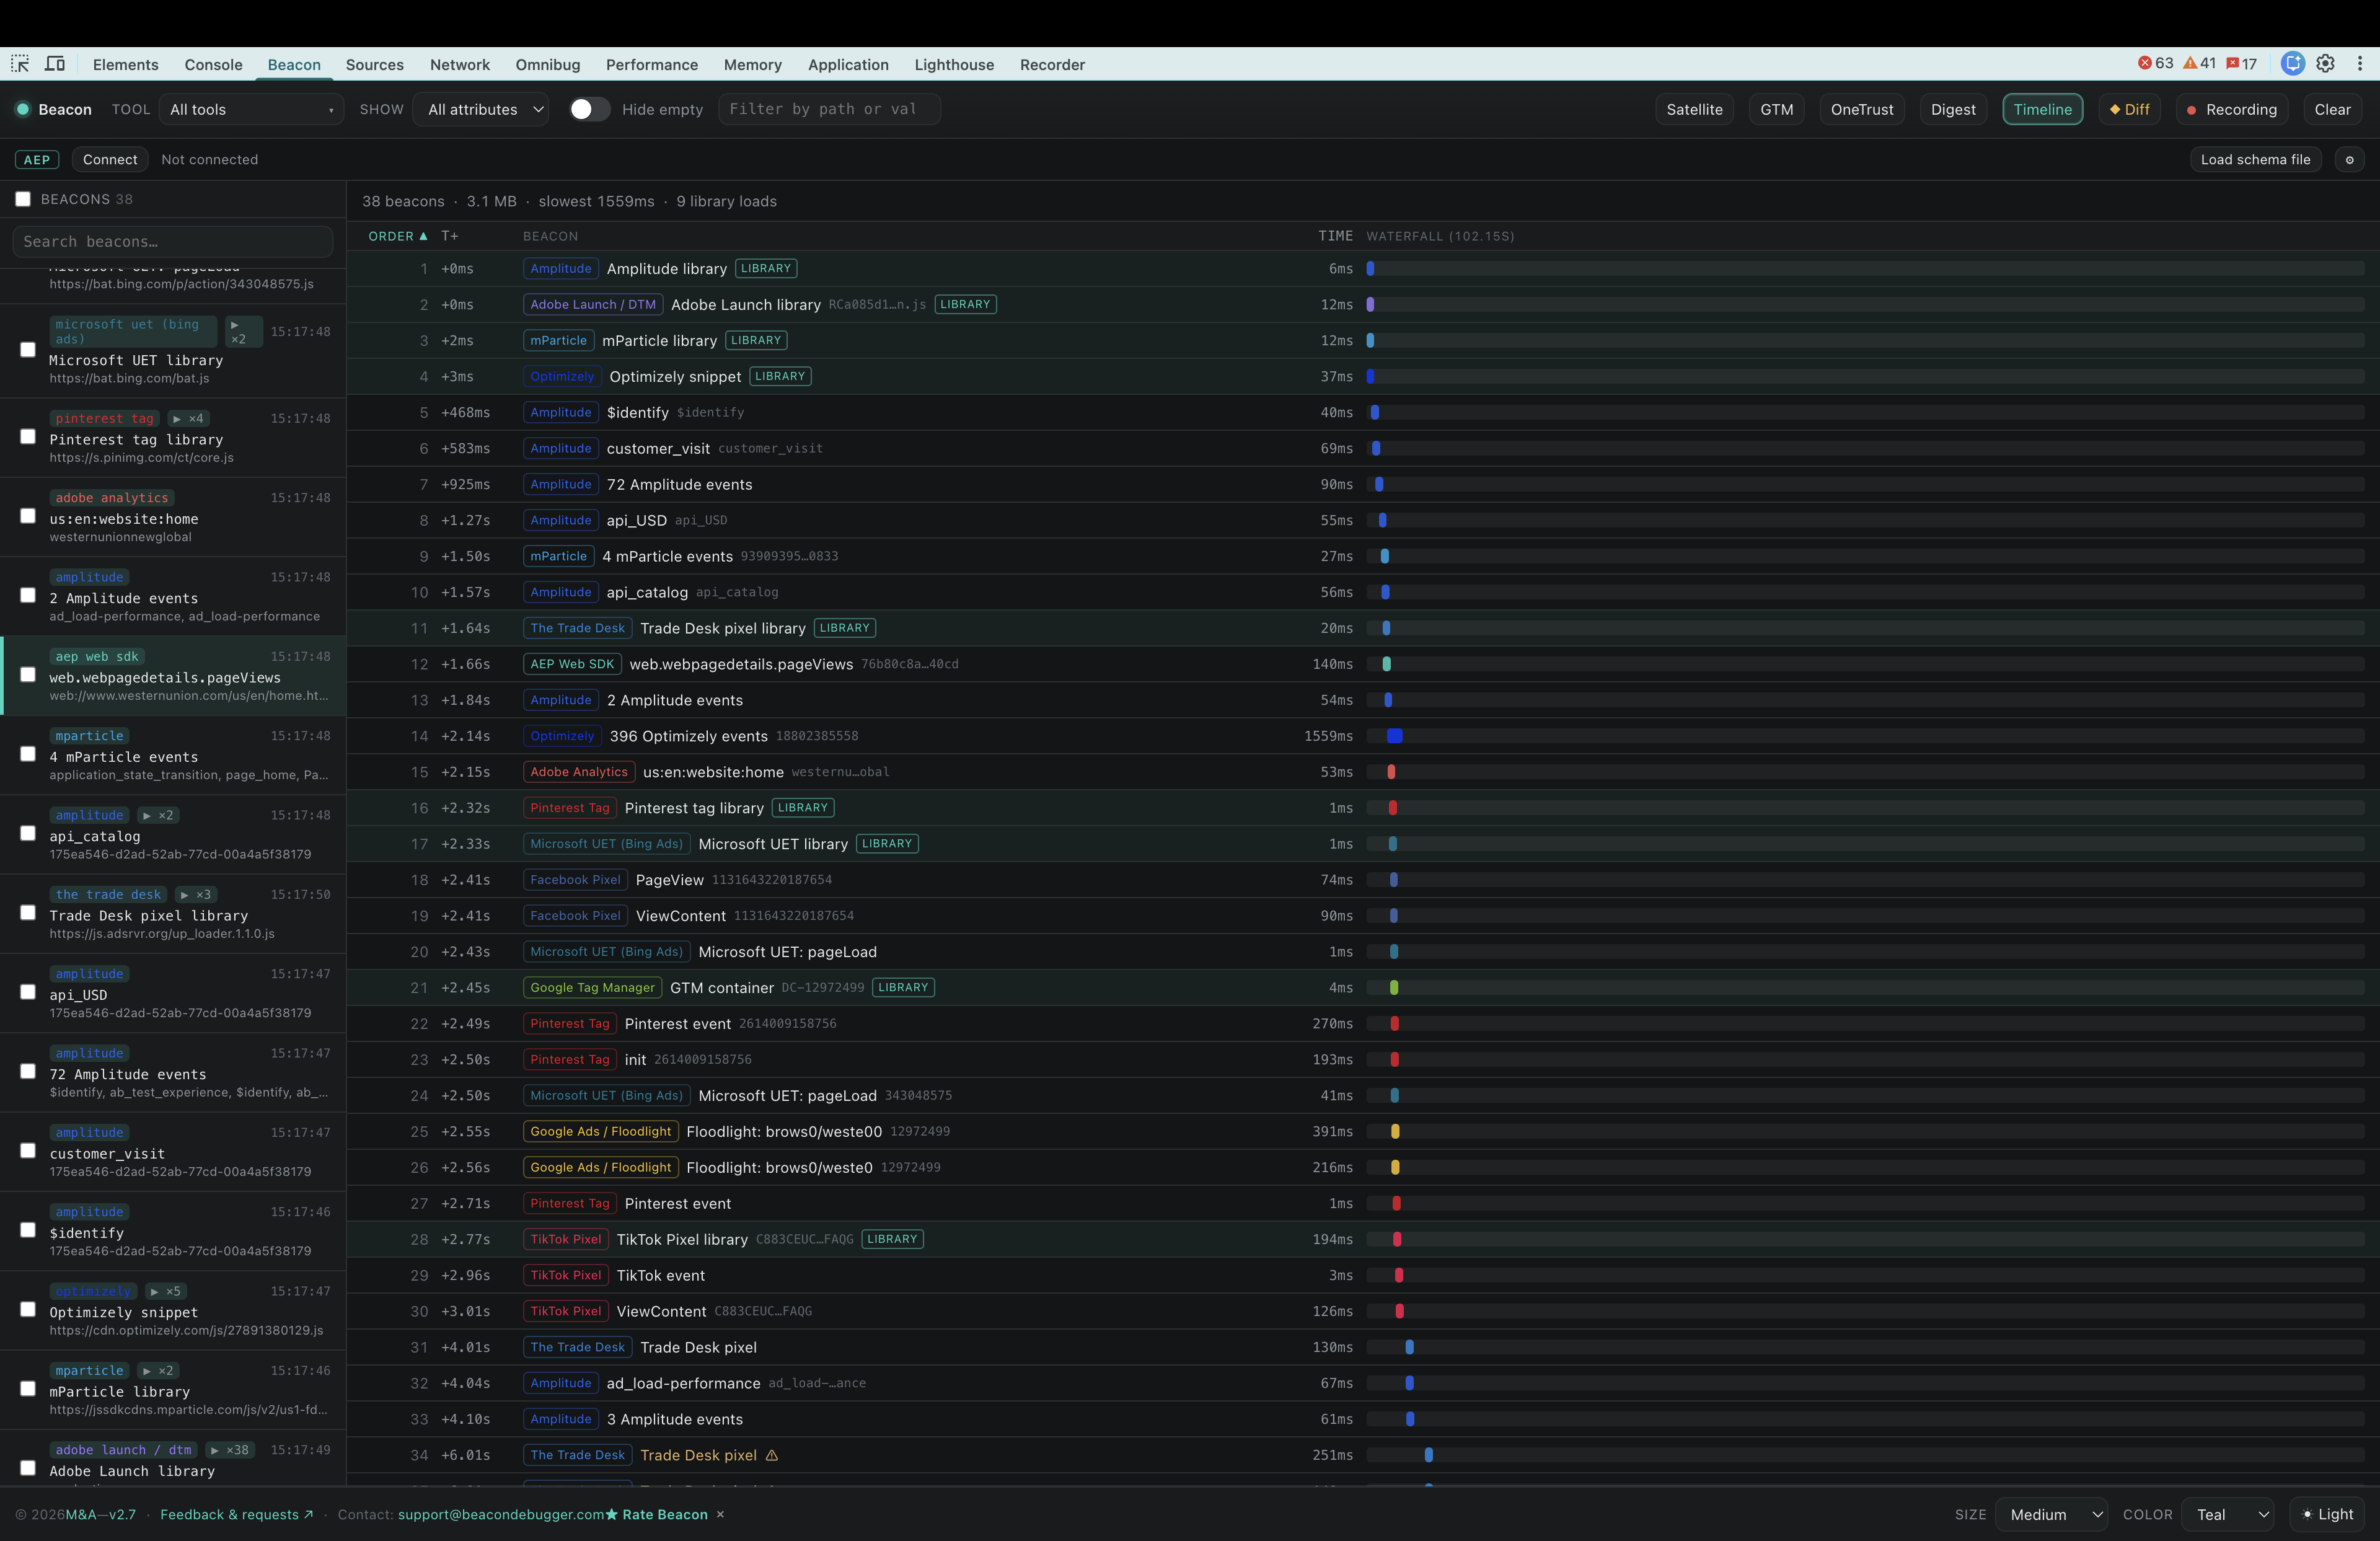
View screenshotUnderstand exactly when analytics libraries initialize, rules execute, and beacons fire with a complete chronological timeline of your page.
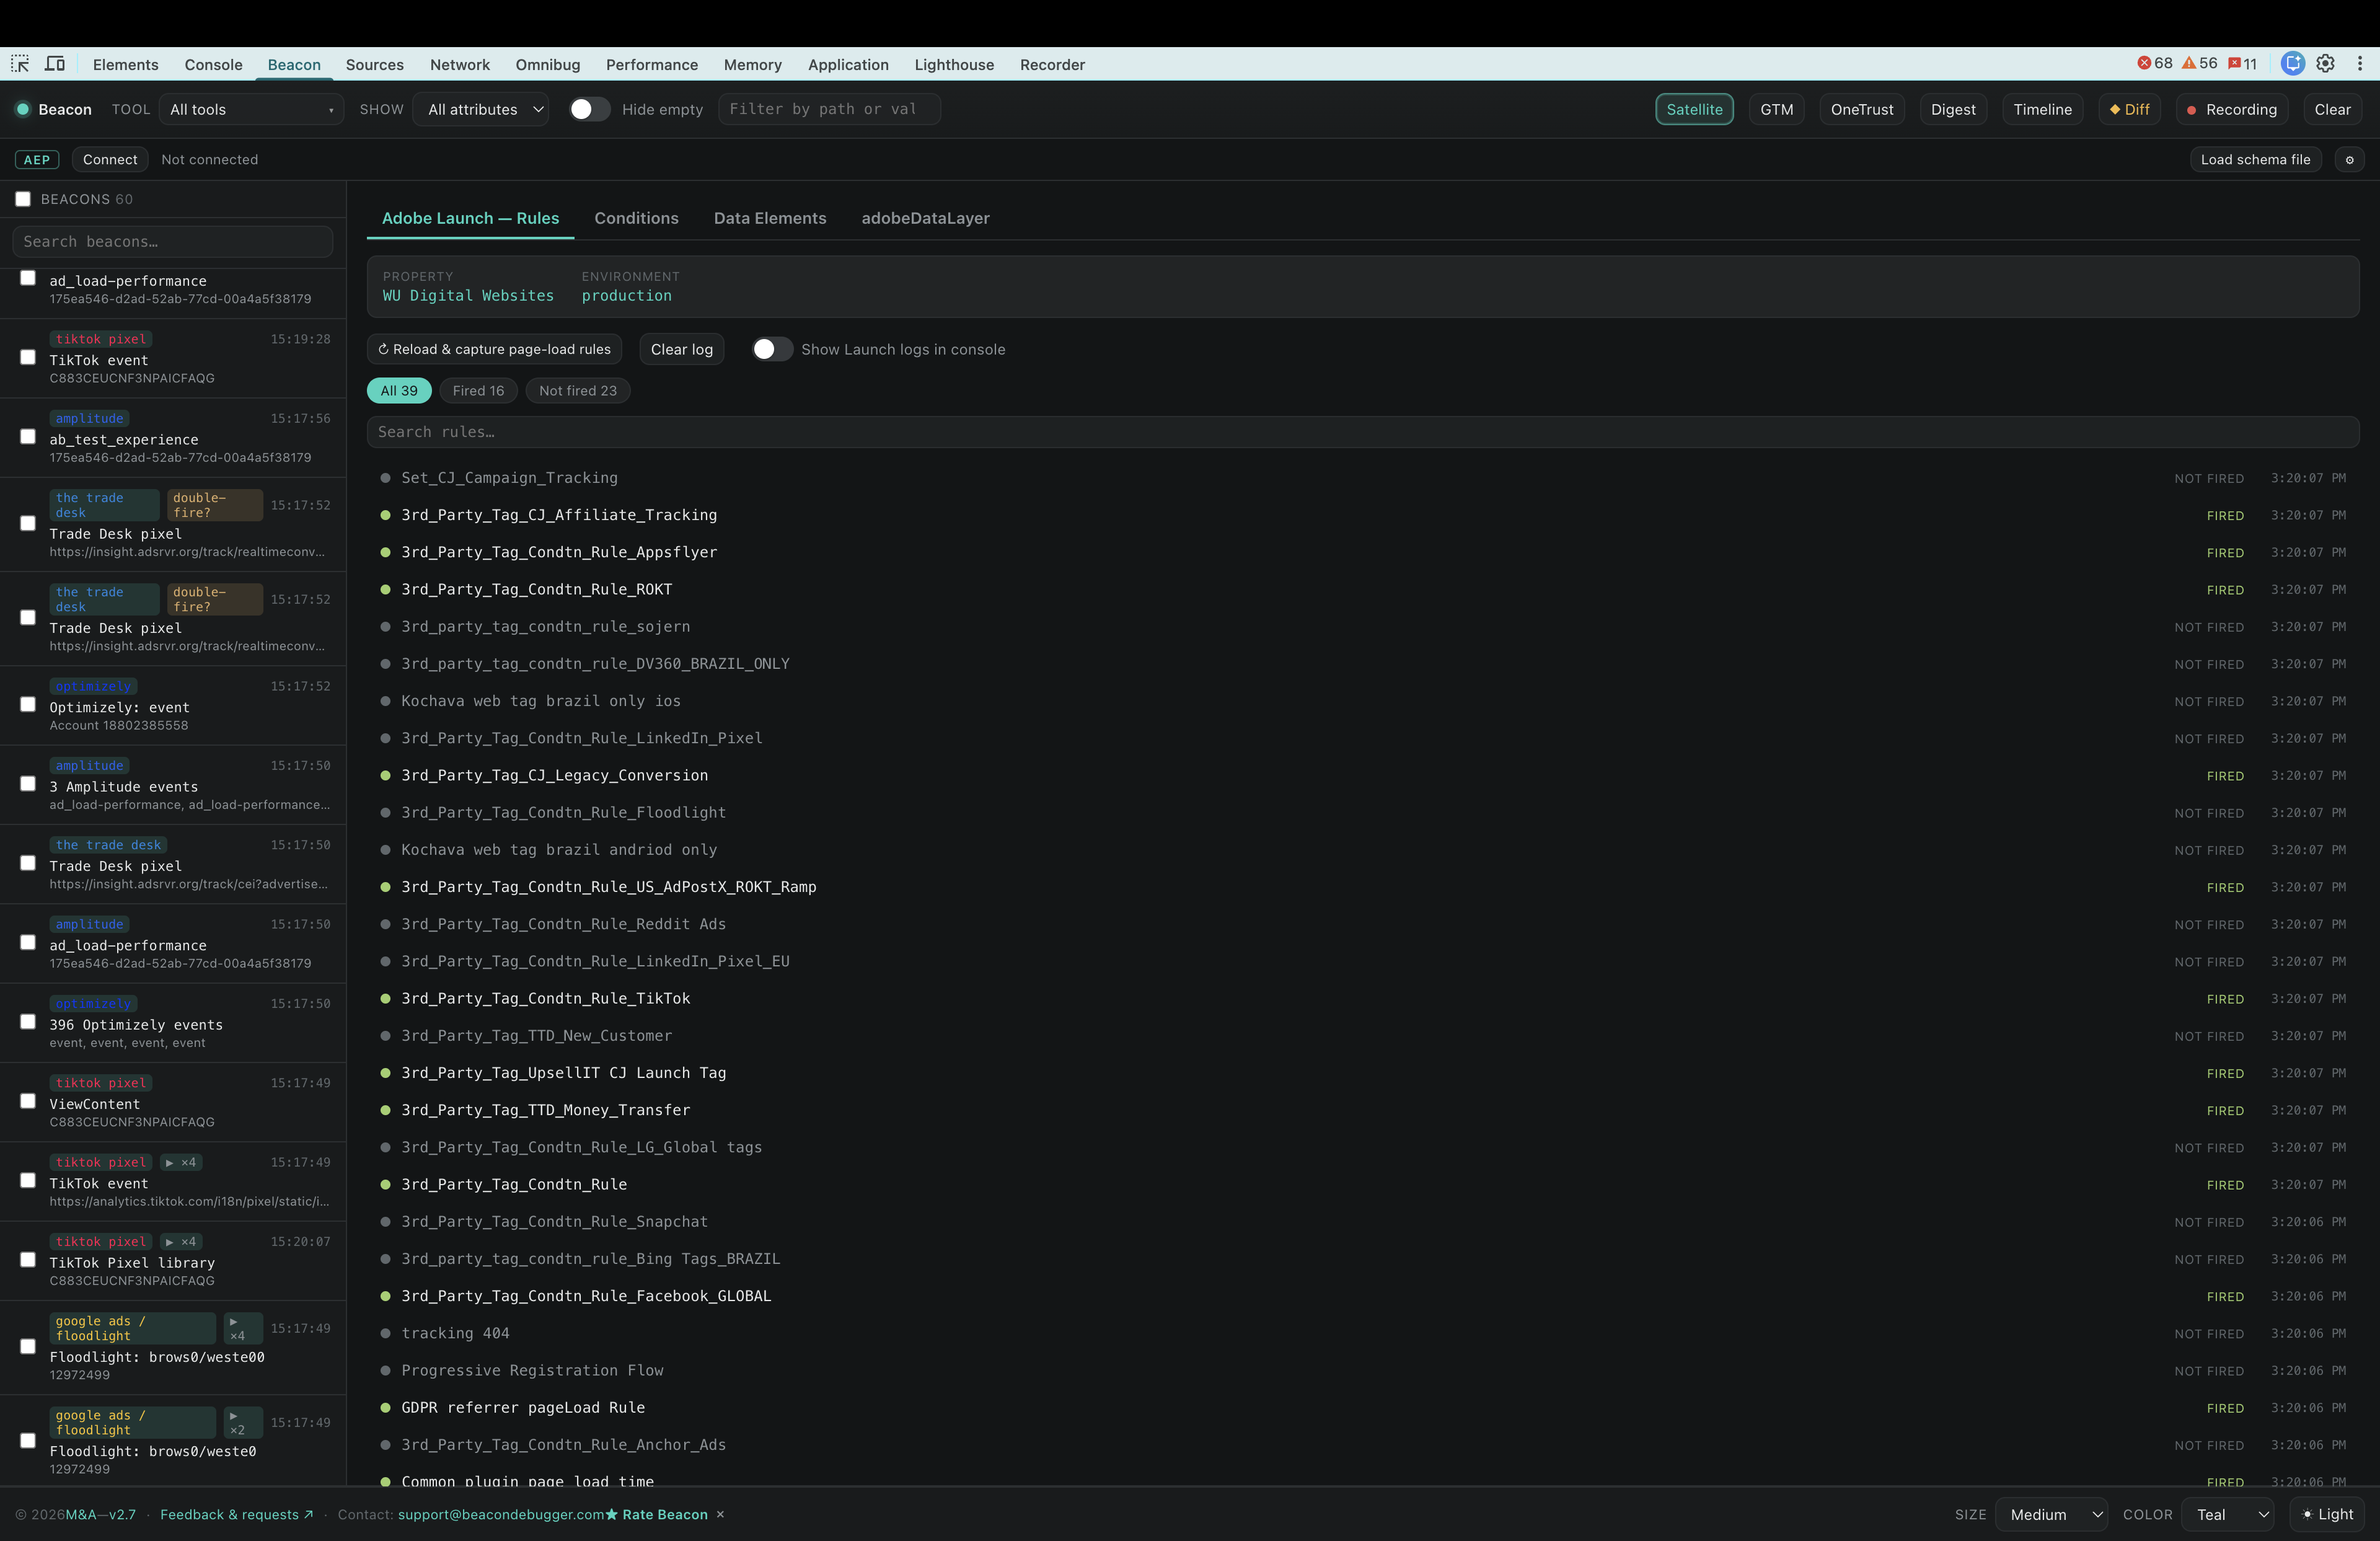
View screenshotInspect rules, variables, data layers, and event execution across Adobe Launch, Google Tag Manager, Tealium, Ensighten, and Piwik PRO.
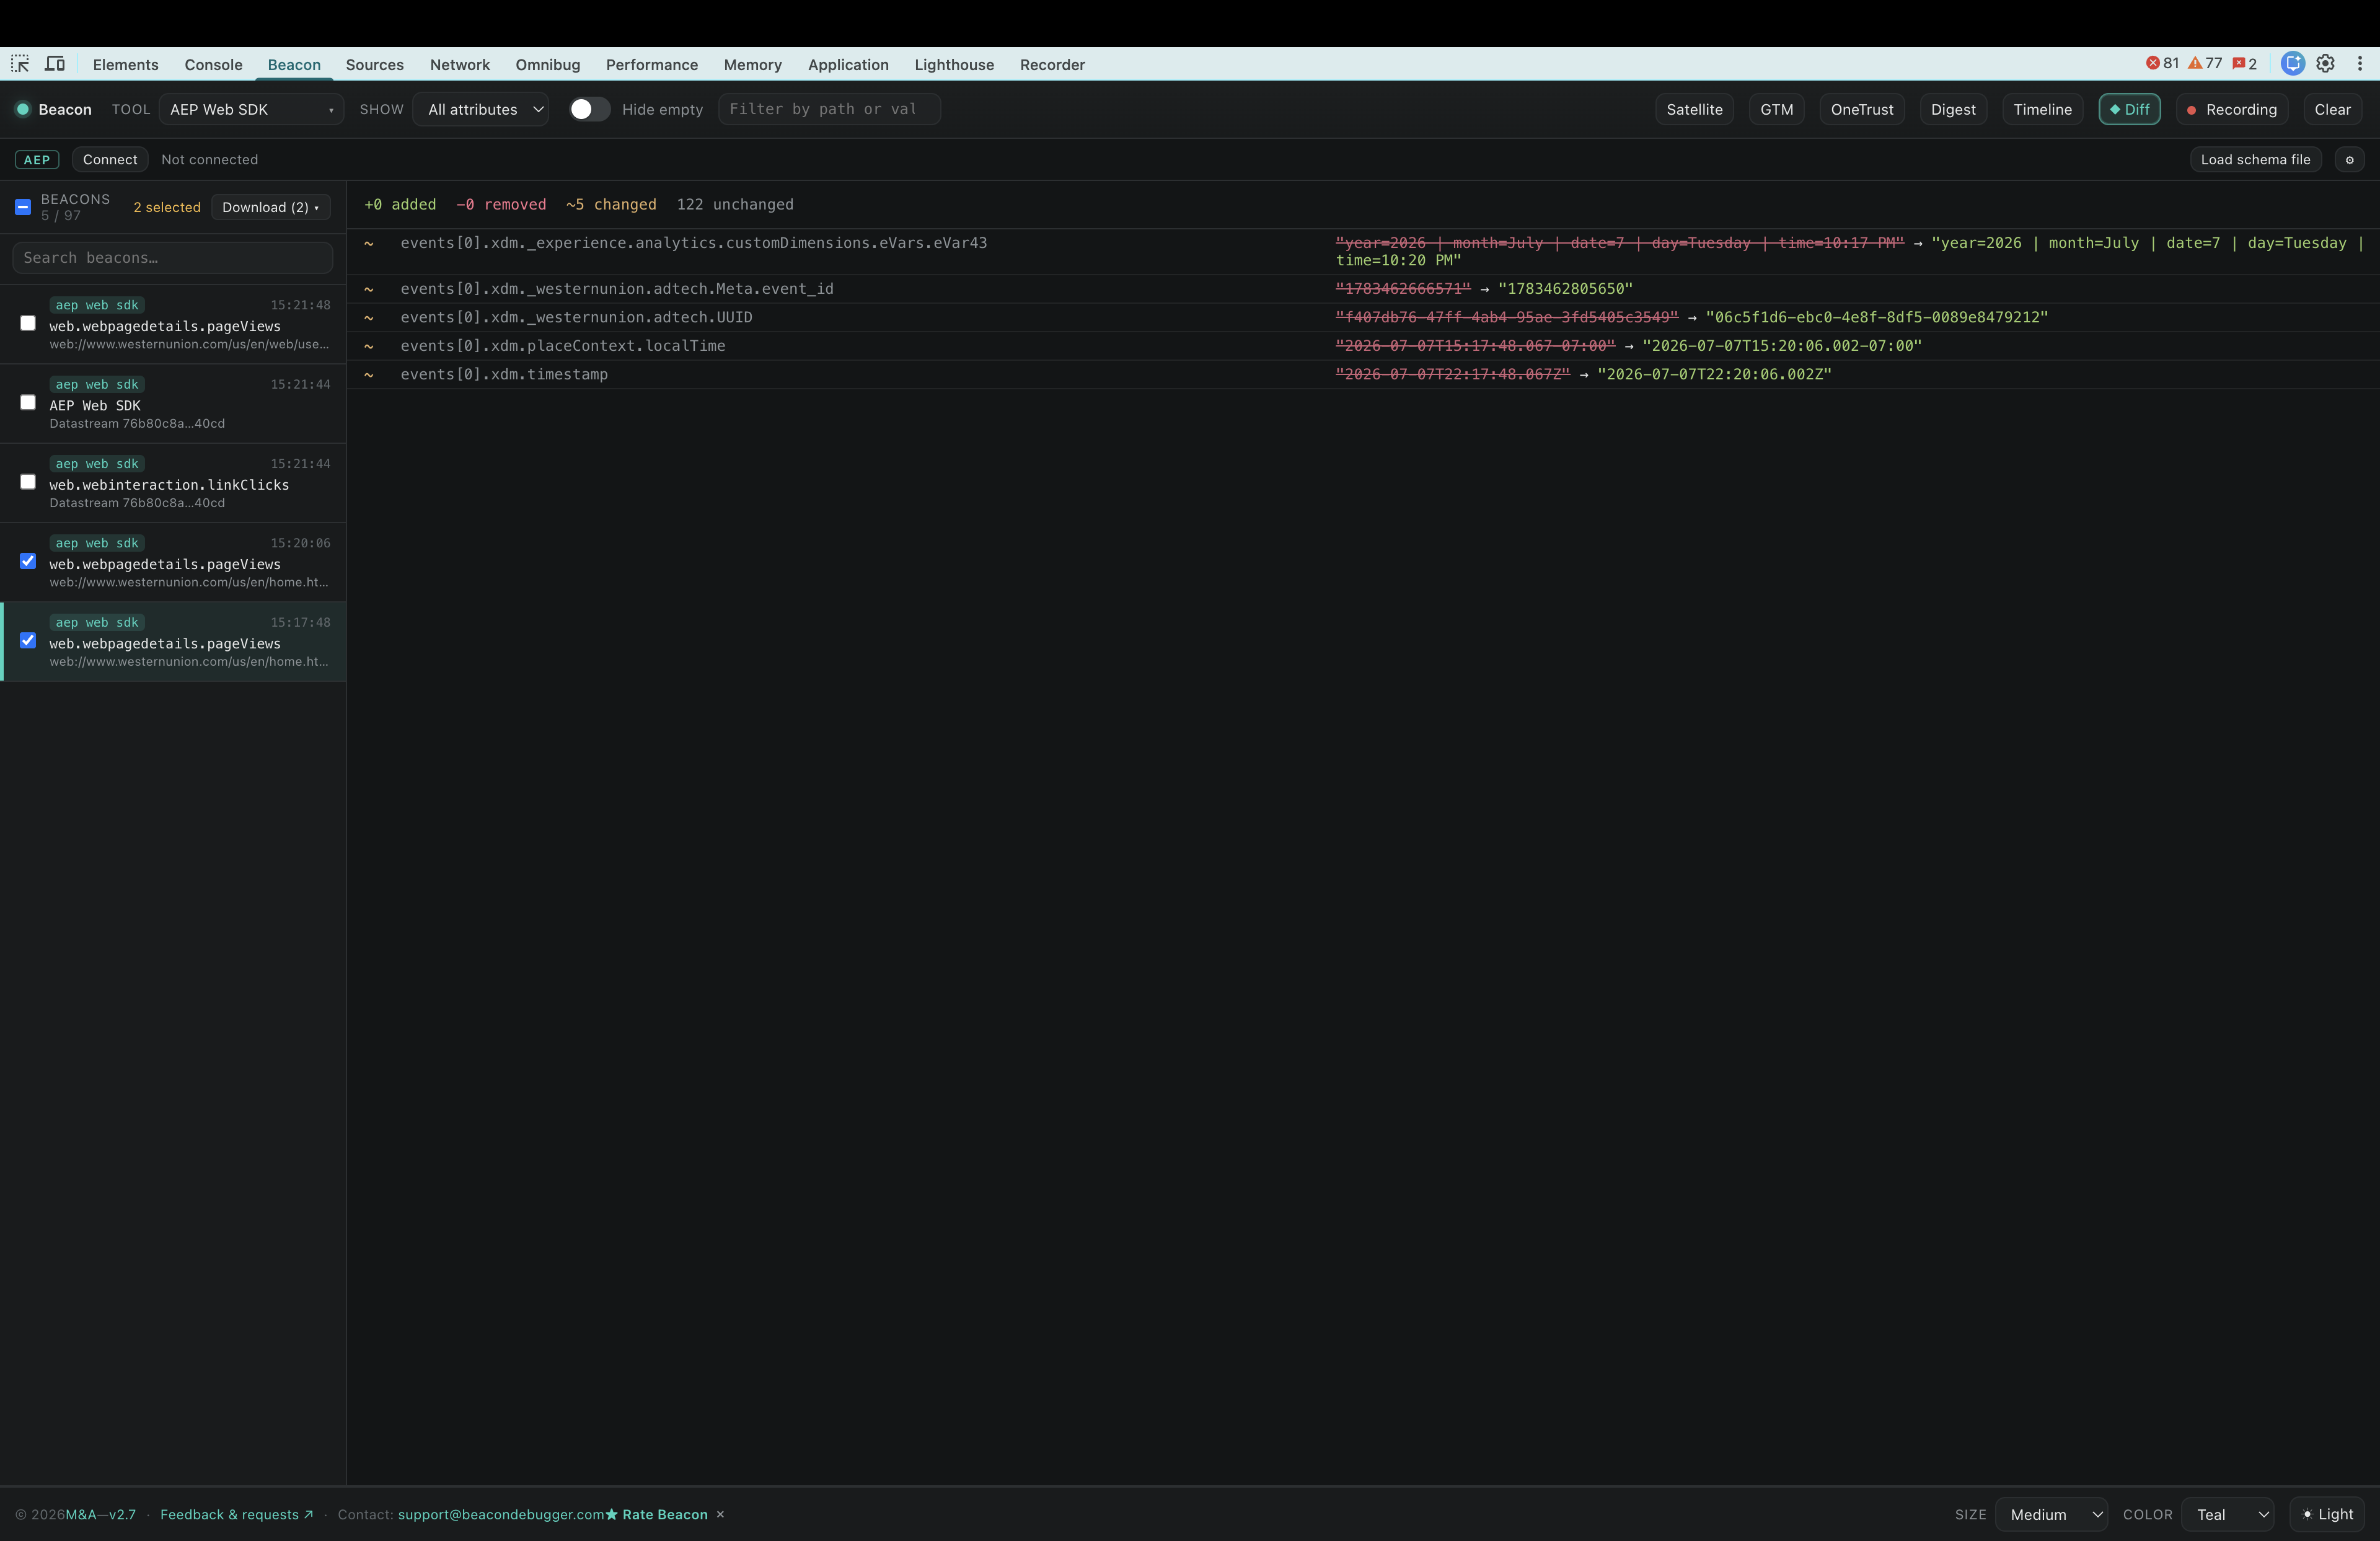
View screenshotCompare any two requests side-by-side and instantly highlight every attribute that changed—perfect for SPA navigation, personalization, and regression testing.
View screenshotConnect directly to Adobe Experience Platform to validate incoming XDM payloads against your production schemas and surface datatype mismatches before they become reporting issues.
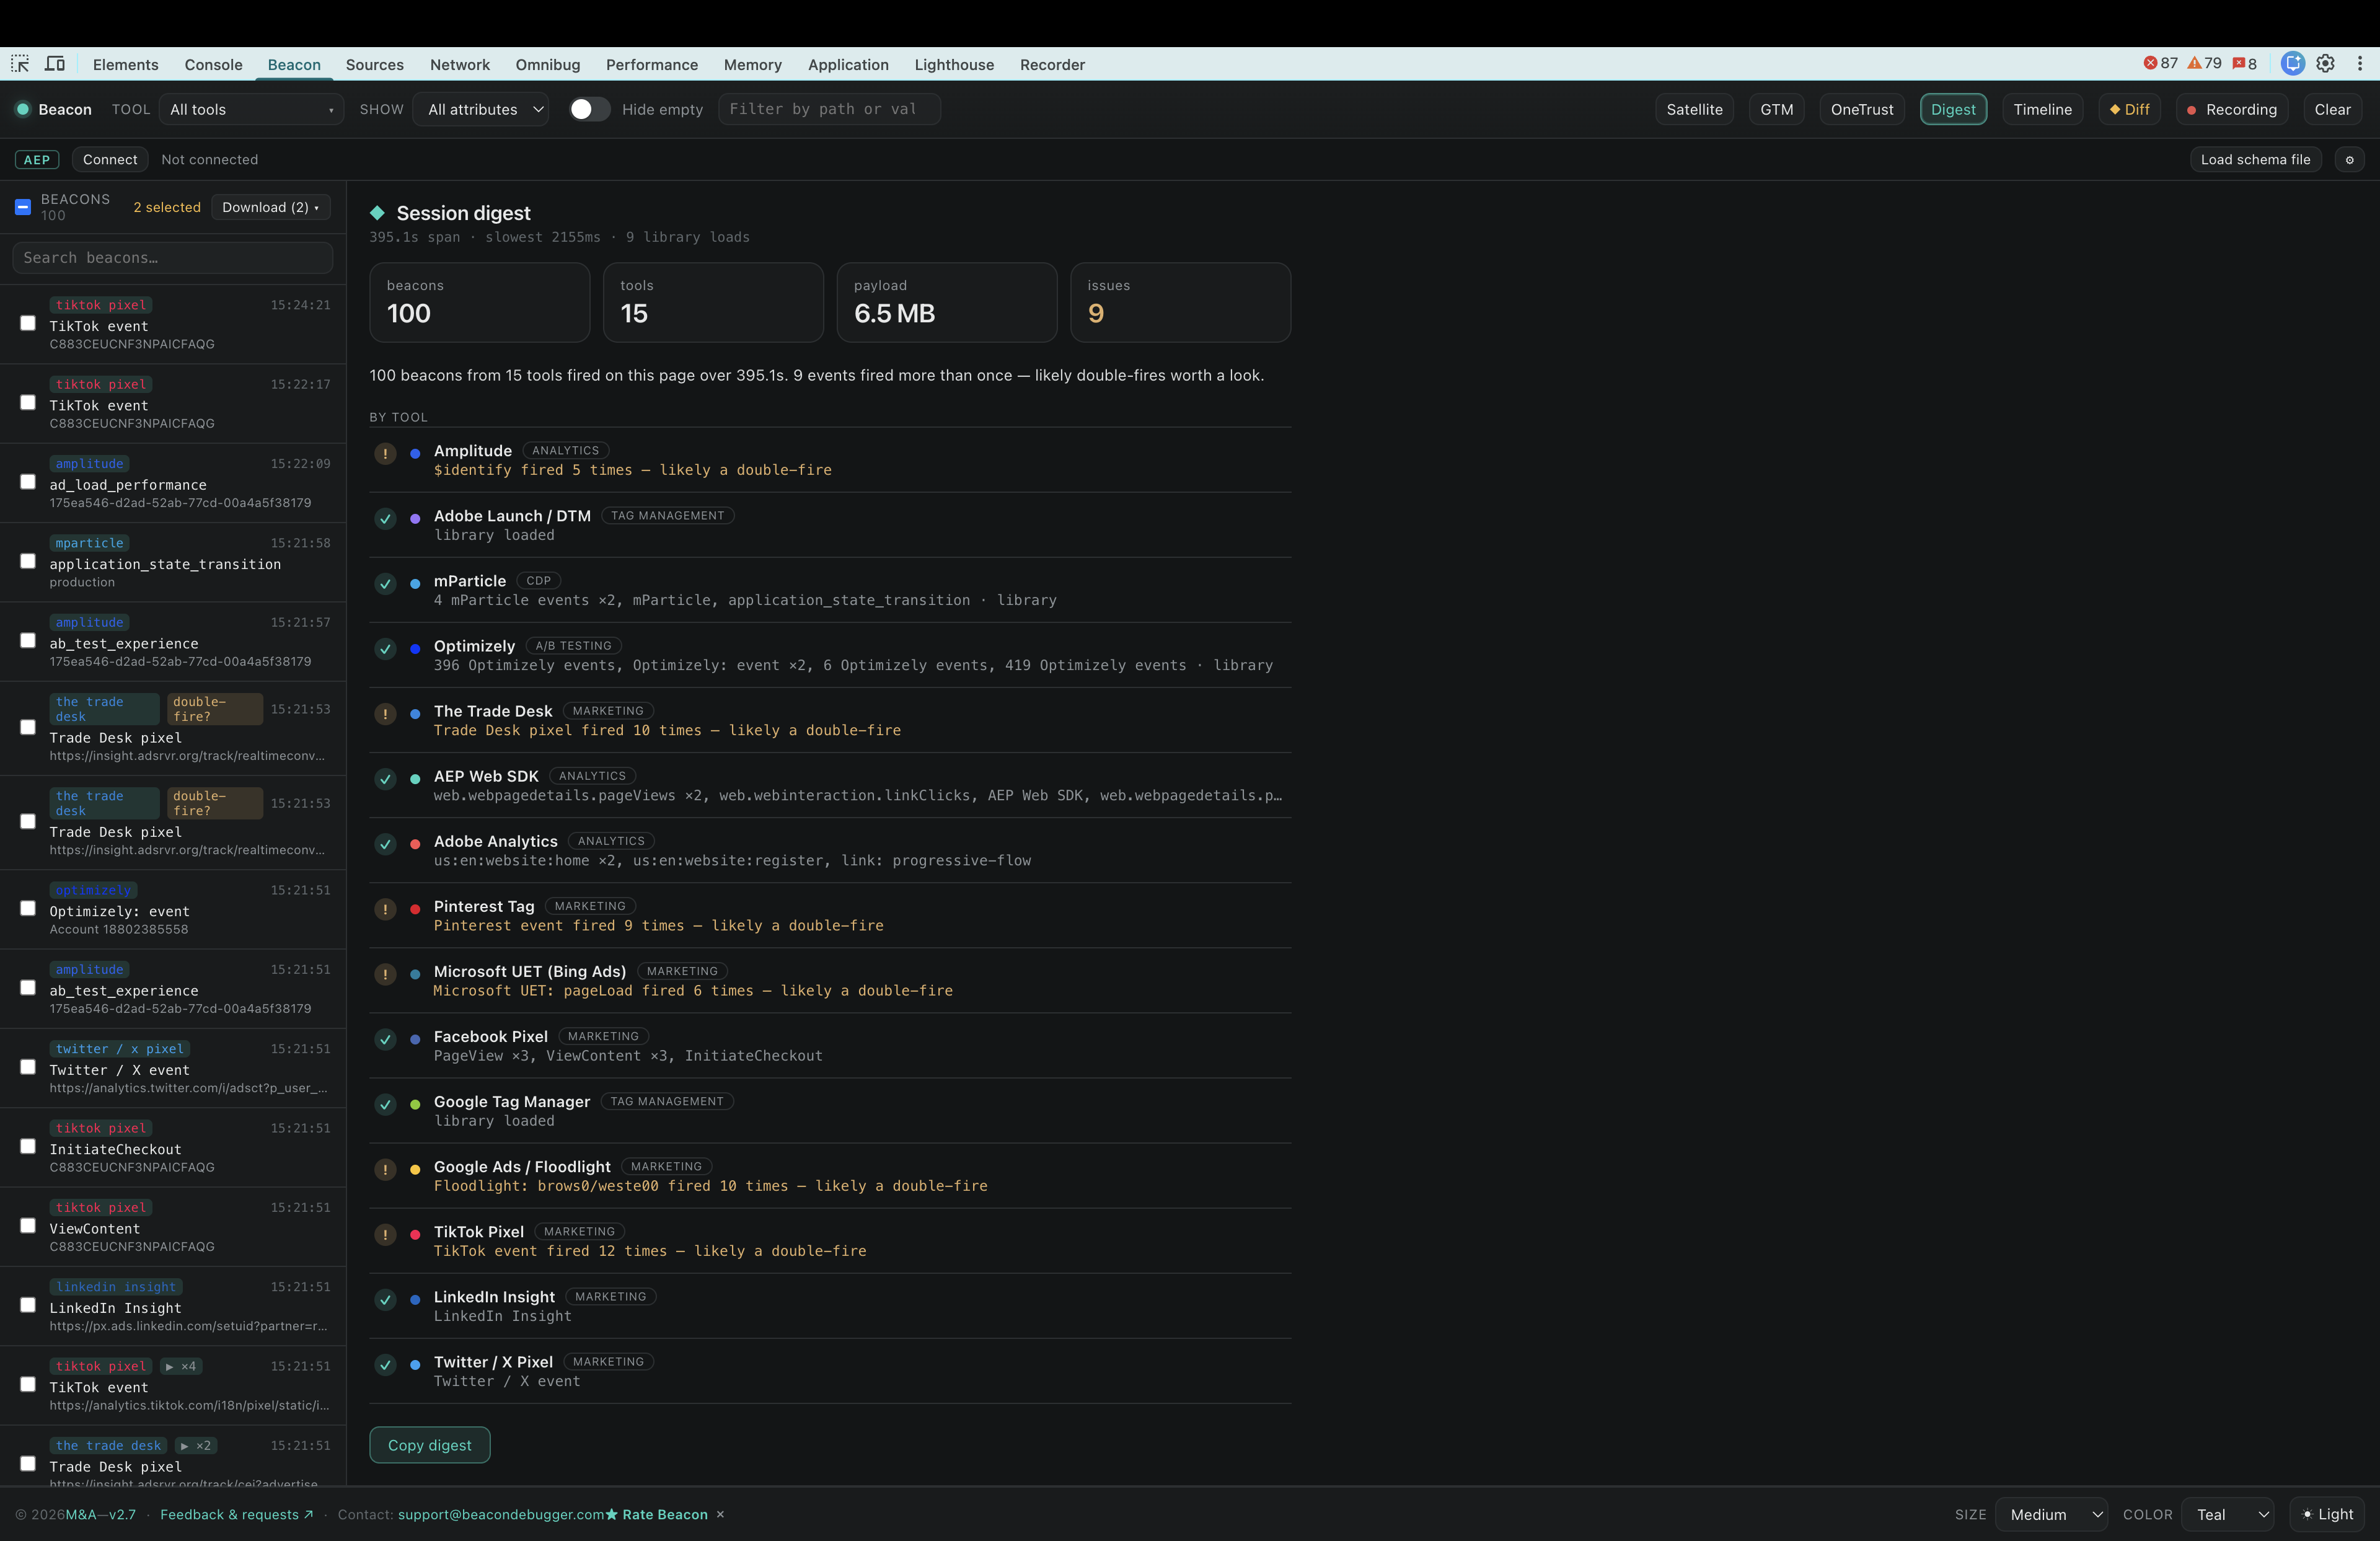
View screenshotGenerate a concise digest of every analytics, marketing, and personalization request captured during a session so you can understand your implementation in seconds.
View screenshot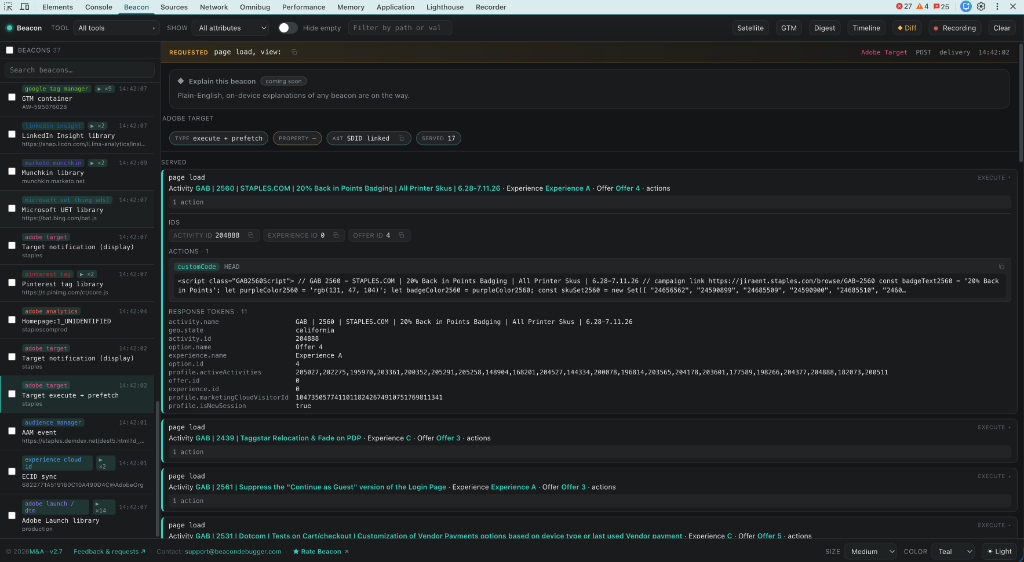
Understand exactly what changed between two hits.
Flag duplicate tracking calls fired within milliseconds.
Save sessions to JSON for documentation or cross-team debugging.
Beacon adapts to your DevTools setup with sharp contrast, dense layouts, and scaling controls for high-resolution monitors.
Join analytics engineers and consultants who use Beacon to validate tracking before it becomes reporting debt.